STATISTICAL ANALYSIS · SURVEYS
Statistical analysis of survey data: a beginner workflow
A survey estimate depends on more than the answers in the spreadsheet. The sample design, nonresponse, question wording and weights all affect what the numbers can represent.
Quick answer: check how respondents were selected, clean and summarize answers, apply the survey’s supplied weights when required, account for the sample design when estimating uncertainty, then report the population and limitations clearly.
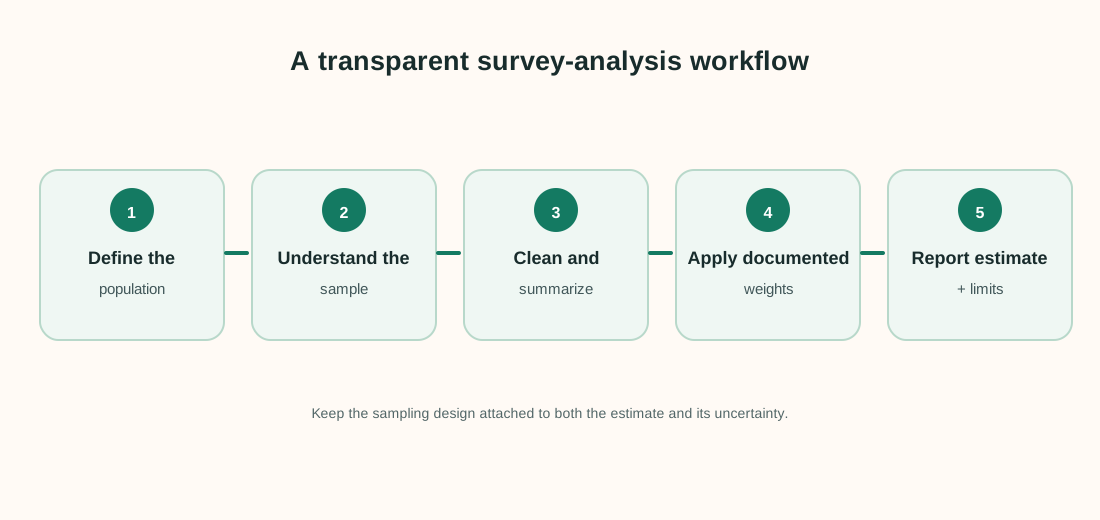
A practical survey-analysis workflow
- Write down the target population. State who the estimate is meant to describe, such as adult residents of a region during a specific month.
- Understand how the sample was drawn. Was it a simple random sample, a stratified sample, a cluster sample or an opt-in panel? The design affects weights and uncertainty.
- Check the data. Confirm coding, skip patterns, duplicates and missing answers. Keep “not asked” separate from “no answer” and from a real zero.
- Summarize answers. Start with counts and percentages for categories, and distributions for numeric answers. Break results down only where the sample supports it.
- Use the supplied weights and design information. Many surveys provide final weights and replicate weights or strata/cluster variables. Follow the survey documentation.
- Report estimates and uncertainty. Include the base or weighted count, denominator, confidence interval or standard error, field dates and important limitations.
What survey weights do
A survey weight represents how much of the target population a respondent stands for in an estimate. A basic design weight is often related to the inverse of a person’s selection probability. Survey organizations may then adjust weights for nonresponse and calibrate them to known population totals.
Weights do not magically remove every bias. They can adjust only for differences measured or represented by the weighting process. If people who do not answer differ in important unmeasured ways, a weighted estimate may still be biased. Extreme weights can also make estimates unstable, so inspect the survey documentation before trimming or changing them.
For uncertainty, do not treat a complex survey as if it were automatically a simple random sample. Clusters, strata and replicate weights affect the variance calculation.
Worked example: why a weighted percentage can differ
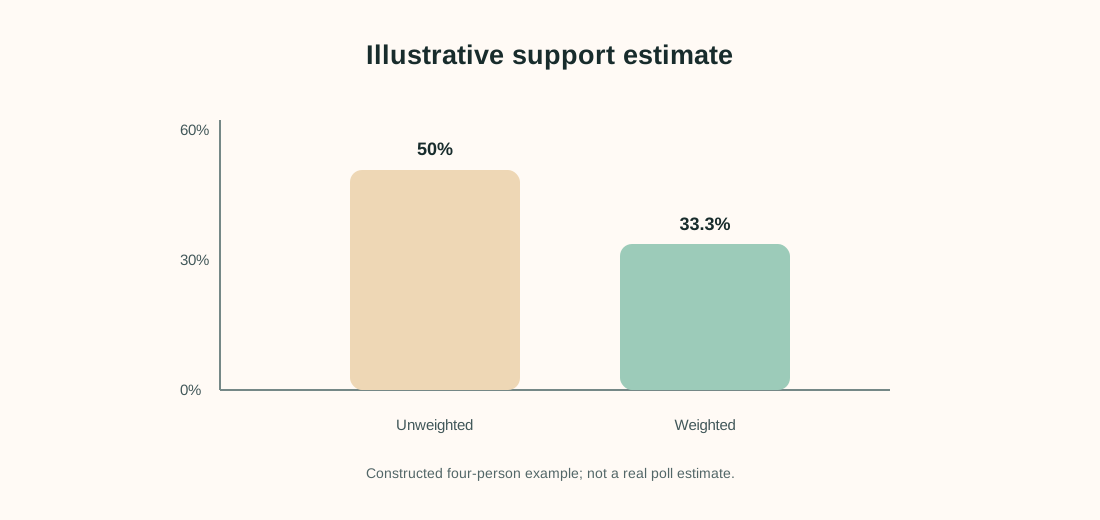
Suppose a survey’s target population has two equally sized groups, A and B. A small illustrative sample contains three people from A and one from B. Two A respondents support a proposal; the third A respondent and the B respondent do not.
| Group | Population share | Sample count | Support count | Weight per respondent |
|---|---|---|---|---|
| A | 50% | 3 | 2 | 0.50 ÷ 0.75 = 0.667 |
| B | 50% | 1 | 0 | 0.50 ÷ 0.25 = 2.000 |
The unweighted sample percentage is 2 ÷ 4 = 50%. The weighted support total is 2 × 0.667 = 1.334; the total weight is (3 × 0.667) + (1 × 2) = 4.001. The weighted estimate is about 1.334 ÷ 4.001 = 33.3%. The B respondent receives more weight because group B was underrepresented in this example.
This calculation illustrates weighting only. A real survey estimate also needs the actual sampling design, nonresponse adjustments and an appropriate variance method. With one respondent in group B, the example is far too small for a useful real-world conclusion.
How to report the result
A useful result might say: “Among the target population of eligible adults, the weighted estimate was 33%, with a 95% confidence interval of [lower, upper]. We used the survey’s final weights and design variables; 12% of eligible sampled people did not respond.” Fill in those numbers from the real analysis rather than copying the illustrative values above.
Also report the question wording, field dates, target population, denominator and missing-answer rule. If the survey used an opt-in panel or a non-probability sample, say so; the usual probability-sampling interpretation of a confidence interval may not apply.
Frequently asked questions
Should I always use survey weights?
Use weights when the survey design or its documentation says they are needed for the target estimate. Do not invent weights from the sample alone or use a supplied weight without understanding what population and adjustments it represents.
Can I calculate a normal confidence interval from weighted percentages?
Not always. Complex sampling, weights, clustering and stratification change the variance. Use the survey’s recommended variance method, such as replicate weights when provided.
What should I do with “prefer not to answer”?
Keep it distinct from missing-by-accident and from a substantive response. Report how it was handled and use a denominator that matches the question being answered.
Does weighting fix nonresponse bias?
It can reduce bias related to observed differences used in the adjustment. It cannot guarantee removal of bias caused by unobserved differences between respondents and nonrespondents.
Sources and next steps
- Office for National Statistics: Sample design and estimation — weighting, nonresponse and design-based uncertainty.
- ONS Labour Force Survey User Guidance — survey weights and nonresponse adjustments.