STATISTICAL ANALYSIS · BEGINNER GUIDE
Statistical Analysis for Categorical Data
Choose summaries and tests for category counts by asking whether you are describing, comparing or predicting a categorical outcome.
Quick answer: Start with counts and denominators. For relationships between categorical variables, a contingency table and a chi-square test may fit when observations and expected counts support it. For prediction, a logistic or multinomial model may be more useful.
What this method answers
Categorical variables describe groups or labels, such as pass/fail, region or product type. Their codes are not automatically numeric measurements: categories 1, 2 and 3 do not have meaningful arithmetic unless the scale supports it.
Separate the question types. A one-variable summary reports category proportions; an association test checks whether two variables are related; a classifier predicts labels from features. Each needs a different estimate and assumptions.
Before running a calculation, write down the population and the exact quantity you want to estimate. A method name alone does not define the question, the comparison or the assumptions.
Steps to follow
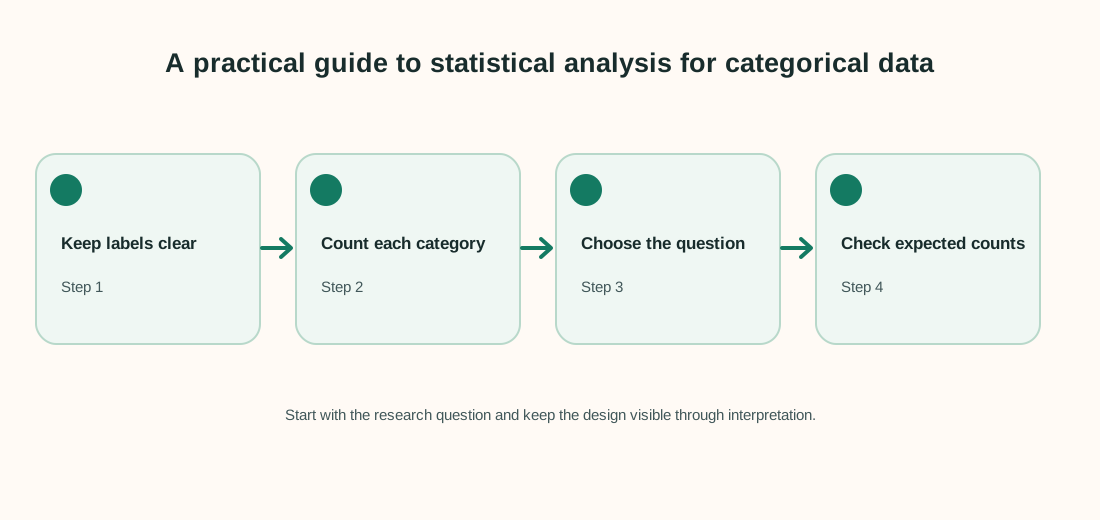
- Preserve category labels and define the denominator for each percentage.
- Make a cross-tabulation before choosing a test.
- Use a test of association for a relationship question, or a model if prediction or adjustment is needed.
- Check independence, sparse cells, missing values and the sampling plan.
Keep a record of exclusions, recoding decisions and software settings. That makes the analysis easier to check and repeat.
Worked example
A small study records whether participants completed a course in two study formats. The invented table reports counts, not scores.
| Format | Completed | Did not complete | Total |
|---|---|---|---|
| Online | 18 | 2 | 20 |
| In person | 12 | 8 | 20 |
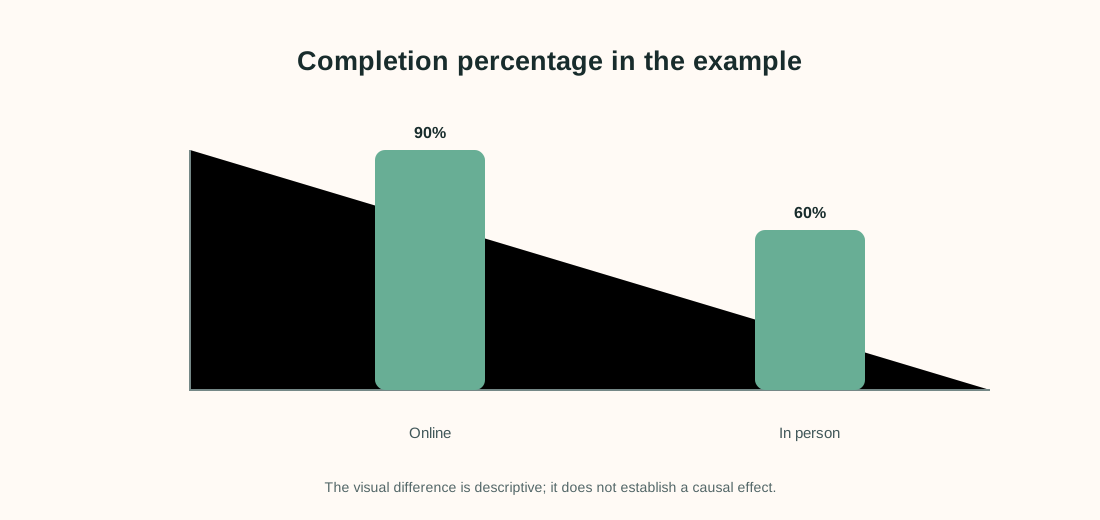
Completion is 18/20 = 90% online and 12/20 = 60% in person. The observed difference is 30 percentage points. The table makes the group sizes visible; an association test would also need to consider whether expected cell counts and the sample design support its approximation.
Interpret the result carefully
The difference describes this sample. If participants selected their format, it is not evidence that online study caused better completion. Confounding factors such as schedule, prior experience or motivation may explain some of the difference.
Limit to keep in mind: Small or sparse tables may need an exact procedure. Repeated observations or clustered sampling require methods that account for dependence.
When reporting an analysis, include the sample size, estimate, units and uncertainty. Explain why the method fits the sampling and measurement design. Separate planned tests from exploratory checks, and avoid saying that association proves a cause.
Frequently asked questions
Can I average category codes?
Only if the numeric coding has a meaningful scale and the analysis supports that interpretation. Nominal labels should usually be summarized with counts or proportions.
When is chi-square useful?
It is commonly used for association between categorical variables when observations are independent and expected counts are adequate for the approximation.
What if a table has small counts?
Consider an exact method for the design, combine categories only when substantively justified, or collect more information.
How do I predict more than two categories?
A multinomial classifier may be suitable, with evaluation choices that reflect category balance and error costs.