QUANTITATIVE ANALYSIS · BEGINNER GUIDE
Prediction Interval vs Confidence Interval in Regression
See why a prediction interval for one new outcome is wider than a confidence interval for the mean response.
Quick answer: A confidence interval at x describes uncertainty about the model’s mean response there. A prediction interval also includes the variation of an individual future outcome around that mean, so it is usually wider.
What this method answers
The mean response is an average over a population of cases at a predictor value. Individual observations vary around that mean. Both intervals rely on the fitted model and assumptions, but answer different questions.
Use a confidence interval when the target is the expected mean at x. Use a prediction interval when asking where a single new observation might fall, and state the predictor value and confidence level.
Before running a calculation, write down the population and the exact quantity you want to estimate. A method name alone does not define the question, the comparison or the assumptions.
Steps to follow
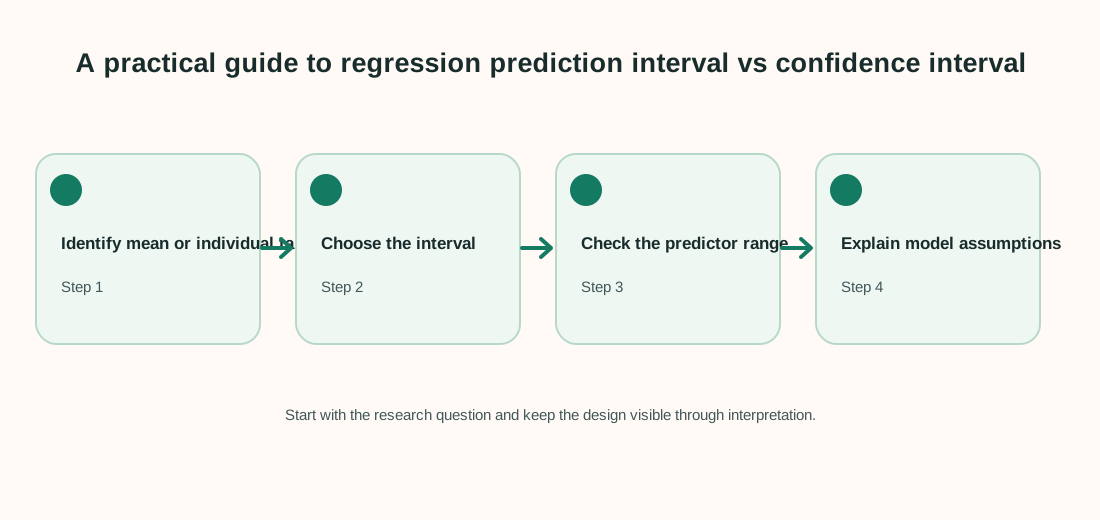
- State whether the question concerns the mean response or one new case.
- Calculate the matching interval from the fitted model.
- Check that the predictor value is represented in the observed data.
- Explain the confidence level and assumptions in plain language.
Keep a record of exclusions, recoding decisions and software settings. That makes the analysis easier to check and repeat.
Worked example
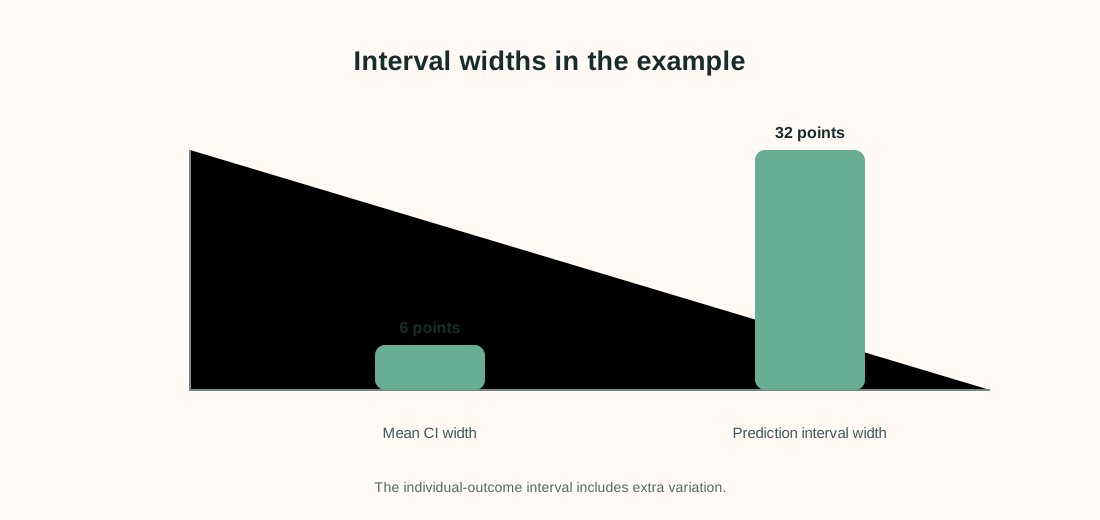
At 5 practice hours, a model predicts a class mean score of 70. An illustrative 95% confidence interval for the mean is 67–73, while a 95% prediction interval for one student is 54–86.
| Interval target at 5 hours | Illustrative 95% interval |
|---|---|
| Mean class score | 67 to 73 |
| One student score | 54 to 86 |
The prediction interval includes uncertainty in the estimated mean plus individual student-to-student variation. That extra source of variation makes 54–86 wider than 67–73 in this example.
Interpret the result carefully
Do not say “95% of class means fall in the prediction interval.” The interval types refer to a repeated-sampling confidence procedure for a mean versus a range for a new individual outcome under the model.
Limit to keep in mind: Intervals can be misleading if the model is misspecified, the predictor value is far outside the training range, or errors are dependent or highly non-constant.
When reporting an analysis, include the sample size, estimate, units and uncertainty. Explain why the method fits the sampling and measurement design. Separate planned tests from exploratory checks, and avoid saying that association proves a cause.
Frequently asked questions
Why is a prediction interval wider?
It includes individual outcome variation as well as uncertainty about the mean response.
Can a 95% interval mean 95% probability for this fixed parameter?
In a frequentist confidence interpretation, the 95% describes long-run coverage of the procedure under assumptions.
Which interval should I use for a new student?
A prediction interval, because the target is one individual score.
Can intervals be trusted outside the data range?
Usually not without strong assumptions; extrapolation can make both the mean and prediction interval unreliable.