QUANTITATIVE ANALYSIS · BEGINNER GUIDE
How to Analyze Likert-Scale Data
Choose summaries and comparisons for Likert responses by distinguishing one ordered item from a multi-item scale.
Quick answer: A single Likert item is ordinal: response categories have an order, but the gaps between categories are not guaranteed to be equal. Start with counts or percentages for each response. A multi-item scale may be summarized differently only when its construction and measurement support that choice.
What this method answers
A response such as “strongly disagree” through “strongly agree” has a clear order. A median or category distribution respects that order; a mean assumes the numeric codes behave like equally spaced measurements.
Researchers often build a scale from several items, reverse-code some questions and assess whether the items measure a coherent construct. Do not combine items only because they share a survey page. State the coding and missing-answer rule.
Before running a calculation, write down the population and the exact quantity you want to estimate. A method name alone does not define the question, the comparison or the assumptions.
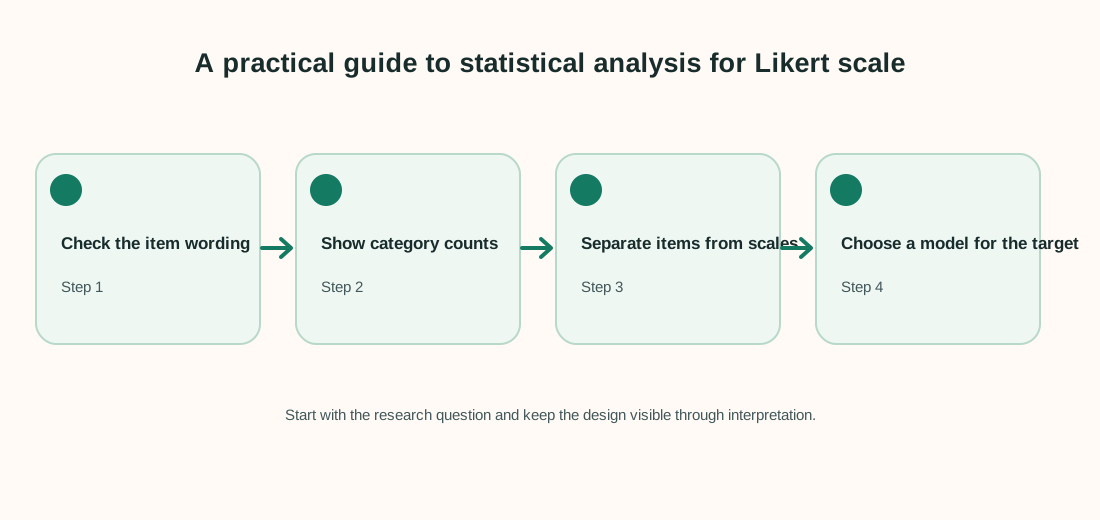
Steps to follow
- Keep the response labels and their ordering visible when cleaning codes.
- Report counts and percentages for each category, with the denominator and missing count.
- For several items, explain reverse coding, scoring and evidence that they form a scale.
- Use an ordinal or other justified model if comparing groups; describe any numeric-score assumption.
Keep a record of exclusions, recoding decisions and software settings. That makes the analysis easier to check and repeat.
Worked example
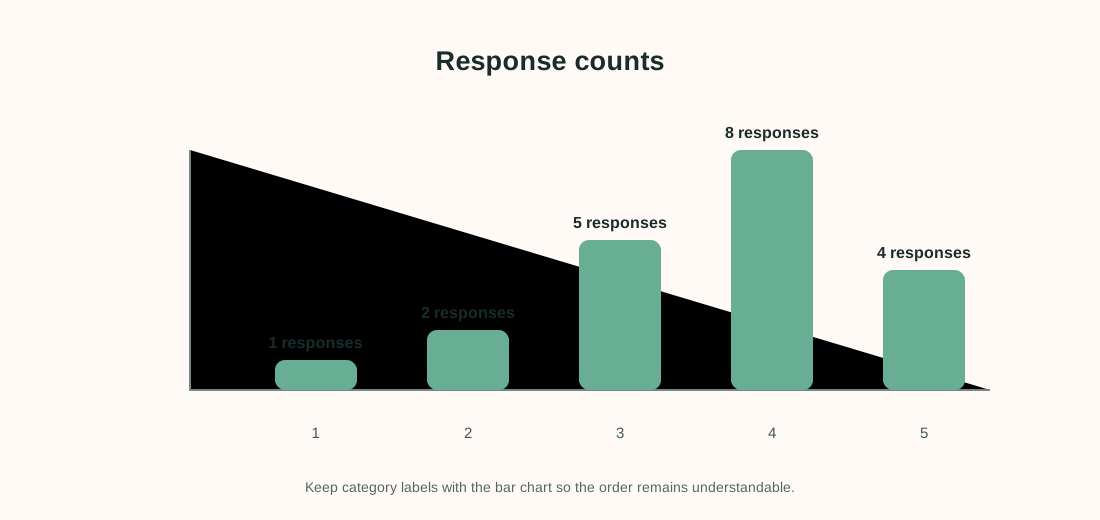
Twenty students answer a five-category satisfaction item. The toy response counts are shown below; category 1 is “strongly disagree” and category 5 is “strongly agree.”
| Response category | Count |
|---|---|
| 1 · Strongly disagree | 1 |
| 2 · Disagree | 2 |
| 3 · Neither | 5 |
| 4 · Agree | 8 |
| 5 · Strongly agree | 4 |
The denominator is 20. “Agree” or “strongly agree” accounts for (8 + 4) ÷ 20 = 60%. The median response is category 4 because the 10th and 11th ordered responses fall in that category. This summary keeps the original categories visible.
Interpret the result carefully
The 60% combined share is easy to read but hides the difference between “agree” and “strongly agree.” Show the full distribution when those distinctions matter.
Limit to keep in mind: A single item may be affected by wording, response style and category interpretation. Do not claim an interval-scale measurement from a Likert label alone.
When reporting an analysis, include the sample size, estimate, units and uncertainty. Explain why the method fits the sampling and measurement design. Separate planned tests from exploratory checks, and avoid saying that association proves a cause.
Frequently asked questions
Can I calculate a mean for one Likert item?
Some analysts do, but it assumes equal spacing between response categories. If you use a mean, justify that choice and also show the distribution.
Is a Likert item the same as a Likert scale?
A single item is one ordered question. A multi-item scale combines several items intended to measure a broader construct.
How do I handle “not applicable”?
Keep it distinct from neutral and from missing-by-accident. State whether it belongs in the denominator for each result.
Which test compares two groups?
The choice depends on the target question, sample design and assumptions; ordinal models or rank methods may be appropriate in some settings.