QUANTITATIVE ANALYSIS · BEGINNER GUIDE
Descriptive Statistics for Ordinal Data
Summarize ordered categories with counts, percentages, medians and distributions without assuming equal category spacing.
Quick answer: Ordinal data have a meaningful order but not necessarily equal gaps between categories. Report category counts and percentages, and consider medians or rank-based summaries rather than automatically treating category labels as equally spaced numbers.
What this method answers
A 1-to-5 satisfaction rating is ordered, but the distance from 1 to 2 may not equal the distance from 4 to 5. Means can still be used under an explicit approximation, but the assumption should be stated and checked.
Show the full response distribution for Likert-type items, especially when categories are few or skewed. For groups, use methods that respect the ordinal scale and study design.
Before running a calculation, write down the population and the exact quantity you want to estimate. A method name alone does not define the question, the comparison or the assumptions.
Steps to follow
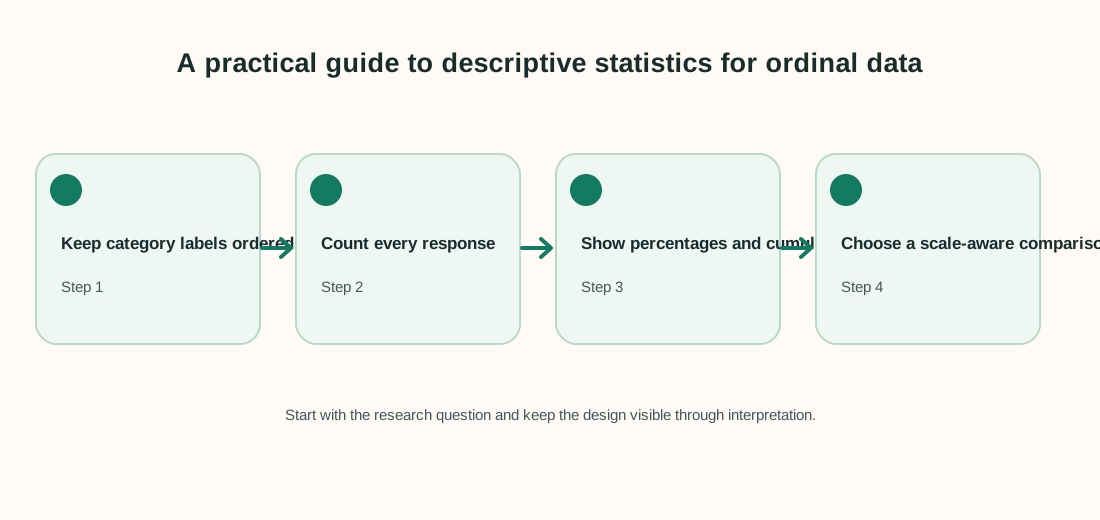
- Preserve the original ordered labels and document any recoding.
- Calculate category counts and percentages with denominators.
- Report median category and mode where useful.
- Use a method that respects ordinal outcomes and the sample design.
Keep a record of exclusions, recoding decisions and software settings. That makes the analysis easier to check and repeat.
Worked example
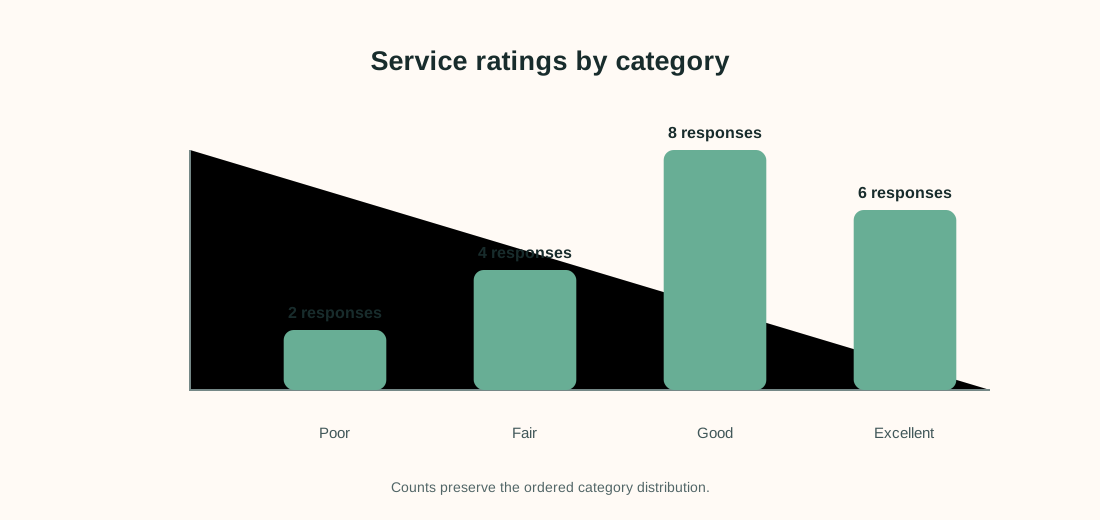
Twenty respondents rate a service: 2 choose “poor”, 4 “fair”, 8 “good” and 6 “excellent”.
| Rating | Count | Percent |
|---|---|---|
| Poor | 2 | 10% |
| Fair | 4 | 20% |
| Good | 8 | 40% |
| Excellent | 6 | 30% |
The cumulative count reaches 10 at “good”, so the median category is “good”. The mode is also “good” with 8 responses. These summaries preserve order without assuming equal distances between labels.
Interpret the result carefully
Most respondents selected good or excellent (14/20 = 70%). The small sample means percentages are uncertain; report counts with them and avoid overstating precision.
Limit to keep in mind: Treating multiple Likert items as a summed scale needs evidence that the items form a coherent construct and a documented scoring rule.
When reporting an analysis, include the sample size, estimate, units and uncertainty. Explain why the method fits the sampling and measurement design. Separate planned tests from exploratory checks, and avoid saying that association proves a cause.
Frequently asked questions
Can I calculate a mean for ordinal data?
It can be an approximation if equal spacing is defensible, but show the distribution and state the assumption.
What is a good summary for one Likert item?
Counts, percentages and the ordered distribution are often the clearest starting point.
Can I add several Likert questions?
Only with a justified scale and documented scoring, ideally with evidence the items measure a coherent construct.
Should I report percentages without counts?
Include counts and denominators so readers can see sample size and precision.