QUANTITATIVE ANALYSIS · BEGINNER GUIDE
Descriptive Statistics for Continuous Variables: A Worked Example
Summarize a measured numeric variable with its sample size, center and spread, then choose a graph that shows the distribution.
Quick answer: Descriptive statistics organize the observed values so readers can see their scale, center and spread. For a continuous measurement, a useful summary often includes the sample size, mean and standard deviation or the median and interquartile range, along with a graph.
What this method answers
The mean and standard deviation summarize a distribution using all values and work naturally for roughly symmetric data. The median and interquartile range are less sensitive to a long tail. Neither pair replaces a look at the actual distribution or the study design.
Use these summaries for measured quantities such as time, weight or temperature. Choose summaries that fit the shape and practical question, keep units visible, and say whether the standard deviation is a sample or population quantity.
Before running a calculation, write down the population and the exact quantity you want to estimate. A method name alone does not define the question, the comparison or the assumptions.
Steps to follow
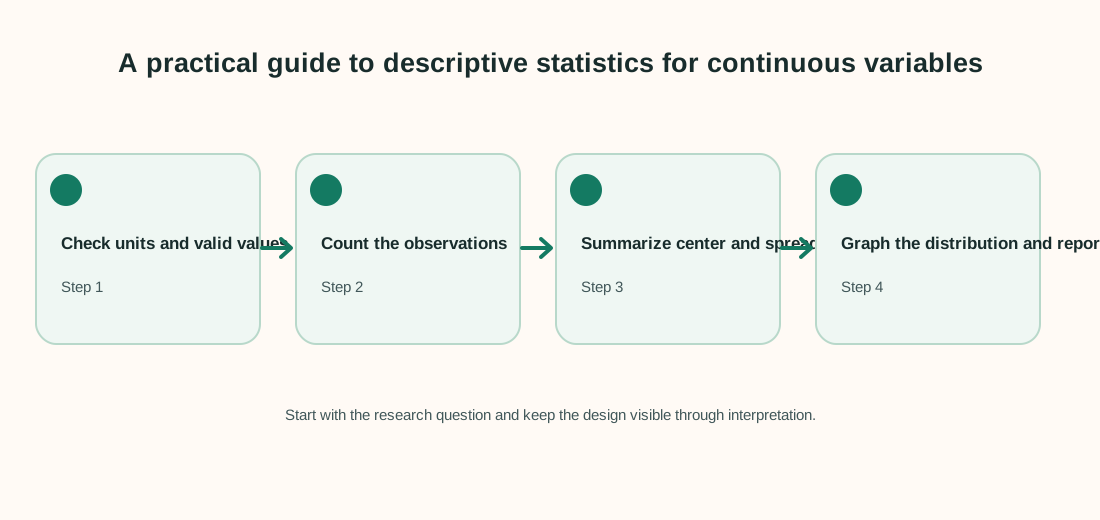
- Confirm that the variable is a numeric measurement and check units and impossible values.
- Report n and calculate a mean/SD or median/IQR pair that fits the question and distribution.
- Draw a histogram or box plot to show skew, gaps and unusual observations.
- Explain the sample, summary convention and limits of what these descriptive values can say.
Keep a record of exclusions, recoding decisions and software settings. That makes the analysis easier to check and repeat.
Worked example
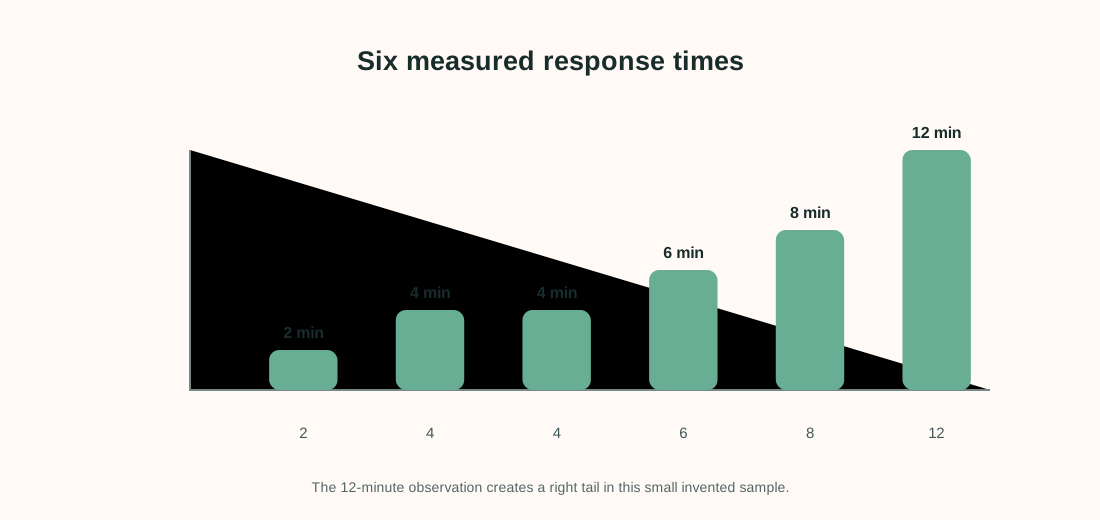
A small team records six invented response times in minutes: 2, 4, 4, 6, 8 and 12.
| Summary | Calculation | Result |
|---|---|---|
| Sample size | Number of observations | 6 |
| Mean | (2+4+4+6+8+12)/6 | 6 min |
| Median | (4+6)/2 | 5 min |
| Range | 12−2 | 10 min |
| Sample SD | √(64/5) | about 3.58 min |
| IQR | Q3−Q1 = 8−4 | 4 min |
The values sum to 36, so the mean is 36/6 = 6 minutes. The two middle values are 4 and 6, making the median (4+6)/2 = 5 minutes. Using the sample standard-deviation formula with denominator n−1 gives √(64/5) ≈ 3.58 minutes. With the median-of-halves quartile convention, Q1 = 4 and Q3 = 8, so IQR = 4 minutes.
Interpret the result carefully
The six times average 6 minutes, while the middle time is 5 minutes. The 12-minute value pulls the mean above the median. This tiny example is descriptive only; it does not estimate a stable service-wide average.
Limit to keep in mind: Quartile algorithms can differ slightly between software, especially in small samples. State the convention when exact quartiles matter, and do not treat a sample SD as the known population SD.
When reporting an analysis, include the sample size, estimate, units and uncertainty. Explain why the method fits the sampling and measurement design. Separate planned tests from exploratory checks, and avoid saying that association proves a cause.
Frequently asked questions
What counts as a continuous variable?
It is a measured numeric quantity that can take values across a scale, such as time, length or temperature. Recorded values may be rounded.
Should I report mean and SD or median and IQR?
Use mean and SD when the distribution and question make them useful; use median and IQR when a long tail or extreme values make resistant summaries clearer. A graph helps decide.
Why does sample SD use n−1?
For a sample, the n−1 denominator is the usual unbiased variance estimator under independent sampling from a population. A population SD uses the population denominator when the full population is observed.
Can descriptive statistics prove a cause?
No. They describe the observed sample. Causal claims depend on the design and assumptions, not on summary statistics alone.