QUANTITATIVE ANALYSIS · BEGINNER GUIDE
How One Outlier Can Change a Correlation
See how one unusual point can sharply change Pearson correlation and why a scatterplot must accompany the coefficient.
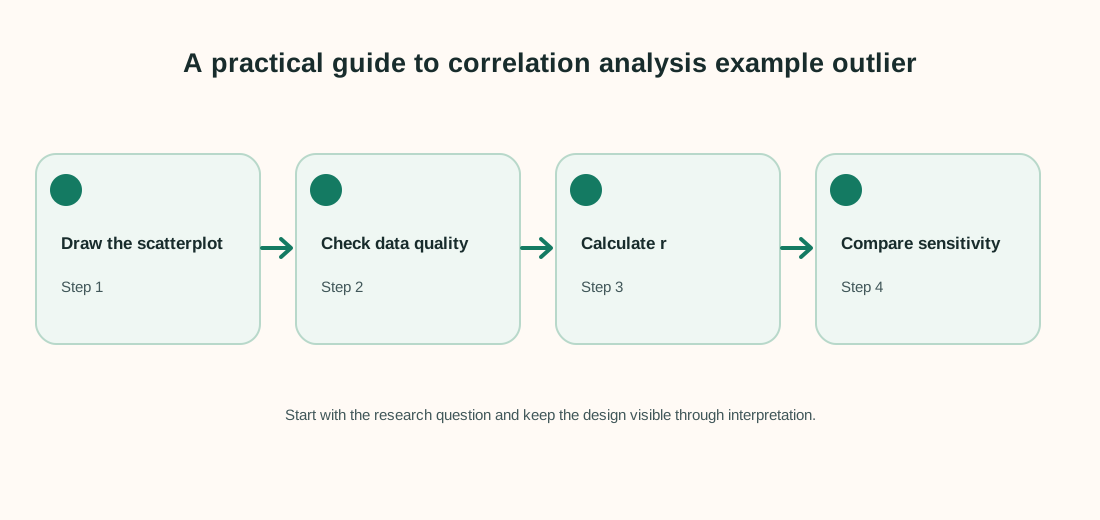
Quick answer: Pearson correlation summarizes linear association across all paired values, so one unusual point can change it substantially. Plot the points, check whether the value is valid and report how sensitive the result is to it.
What this method answers
Correlation ranges from −1 to +1. Values near +1 indicate a strong positive linear pattern, values near −1 a strong negative linear pattern, and values near 0 little linear association. A value near zero does not rule out a curved relationship.
Pearson correlation is sensitive to extreme observations because it uses distances from the means. Do not remove a valid point to improve the coefficient; explain what it represents and compare results with and without it as a sensitivity check.
Before running a calculation, write down the population and the exact quantity you want to estimate. A method name alone does not define the question, the comparison or the assumptions.
Steps to follow
- Keep each x value paired with its matching y value.
- Draw a scatterplot before interpreting a coefficient.
- Check unusual points against the original source and measurement process.
- Report the correlation, sample size, plot and any justified sensitivity analysis.
Keep a record of exclusions, recoding decisions and software settings. That makes the analysis easier to check and repeat.
Worked example
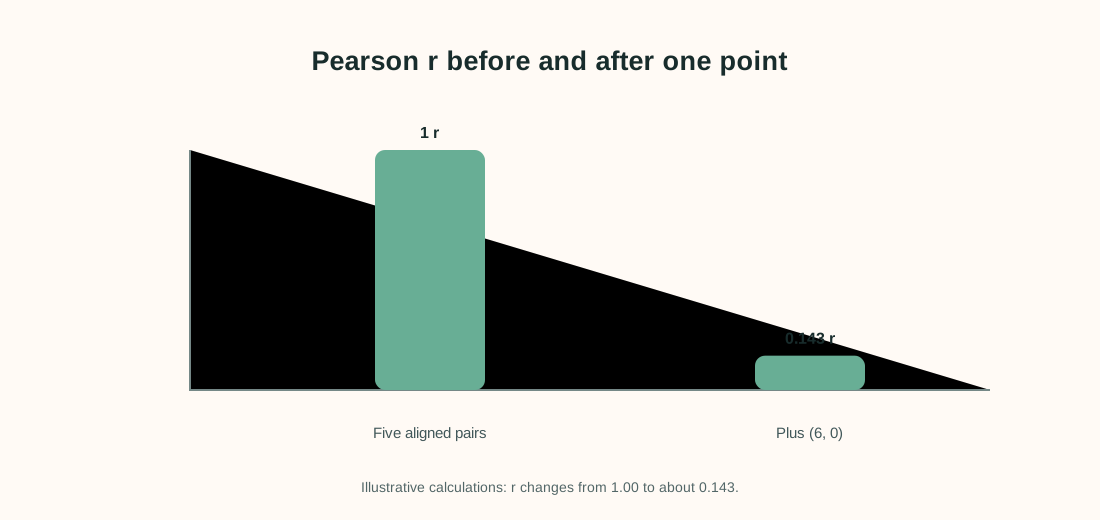
Five points follow y = 2x exactly. Then one extra point, (6, 0), is added. The points are made up to demonstrate sensitivity.
| x | y without extra point |
|---|---|
| 1 | 2 |
| 2 | 4 |
| 3 | 6 |
| 4 | 8 |
| 5 | 10 |
For the first five pairs, Pearson r = 1.00 because the points lie exactly on a straight rising line. Add (6, 0), and the correlation becomes about 0.143. The extra point does not prove the original data were wrong; it shows that the coefficient depends strongly on the full pattern.
Interpret the result carefully
The coefficient alone hides whether a trend is steady, curved or driven by one case. A scatterplot lets readers see the geometry and judge whether a linear summary is meaningful.
Limit to keep in mind: Correlation describes association, not causation. For a very small sample, a single point can dominate and uncertainty around r is large.
When reporting an analysis, include the sample size, estimate, units and uncertainty. Explain why the method fits the sampling and measurement design. Separate planned tests from exploratory checks, and avoid saying that association proves a cause.
Frequently asked questions
Should I remove a point that changes r?
Only if investigation shows it is invalid or outside the stated target population. Otherwise keep it and explain its influence.
Does r = 0 mean no relationship?
It means no linear correlation in the sample; a curved or otherwise non-linear pattern can still exist.
Does high correlation prove one variable causes the other?
No. Confounding, reverse direction or coincidence may explain an association.
Should I report r without a chart?
A scatterplot is strongly recommended because the same coefficient can summarize very different point patterns.