STATISTICAL METHODS · BEGINNER GUIDE
How to choose a statistical method for your data
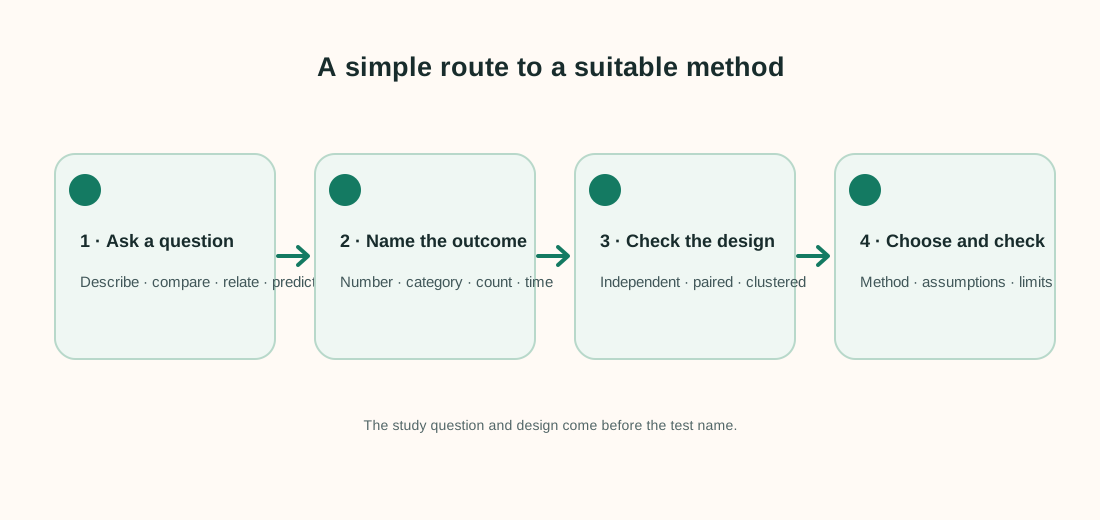
Start with the question, the kind of outcome you measured and how the observations are connected. Those three details narrow the choices much faster than searching for a test by name.
Quick answer: choose a method that matches your research question and study design. For example, compare paired before-and-after measurements with a paired method; compare unrelated groups with an independent-groups method. Check assumptions before using a test or model.
Start with the question, not the test name
Write your question in one sentence. Are you describing a group, comparing two or more groups, checking whether two measurements move together, or predicting an outcome? A test cannot fix a question that is unclear.
Next, identify the outcome. A measurement such as time or score is numeric. A label such as “passed” or “did not pass” is categorical. Counts, ranks and repeated measurements may need special treatment. Finally, ask whether rows are independent or linked: the same person measured twice, students in the same classroom, or repeated days from one machine are not interchangeable independent rows.
A short map of common methods
- Summarize one numeric variable: use a mean and standard deviation when a typical value and spread are useful; add a plot and consider the median and quartiles when the distribution is skewed or has outliers.
- Compare two independent numeric groups: a two-sample t-test is a common starting point when its assumptions fit. For paired measurements, use a paired analysis of within-person differences.
- Compare three or more groups: ANOVA is a common model for numeric outcomes. It tests whether the group means are all equal; follow-up comparisons need their own plan.
- Study an association between numeric measurements: a scatterplot is essential. Pearson correlation describes linear association; Spearman correlation describes rank-based monotonic association.
- Predict a numeric outcome: linear regression is a possible model. Predict a category: logistic regression or another classifier may fit.
- Compare category counts: a chi-square test can compare observed counts with expected counts when its sampling assumptions are reasonable.
This map is not a substitute for a study plan. The correct method can change with clustering, survey weights, small samples, censoring, repeated measures or a non-random sample.
Worked example: before-and-after exam scores
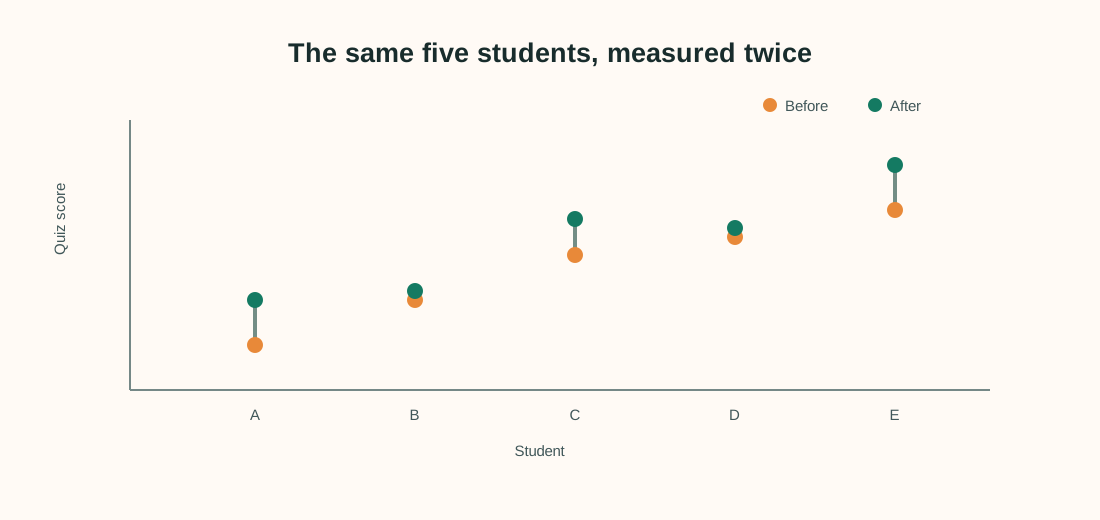
Five students take a short quiz before and after practice. The before and after scores belong to the same students, so treat each row as a pair.
| Student | Before | After | Change |
|---|---|---|---|
| A | 60 | 65 | +5 |
| B | 65 | 66 | +1 |
| C | 70 | 74 | +4 |
| D | 72 | 73 | +1 |
| E | 75 | 80 | +5 |
The five changes add to 16 points, so the sample’s average change is 16 ÷ 5 = 3.2 points. This is a descriptive result for these five students. If the goal is to test whether the average change differs from zero in a larger population, a paired t-test may be suitable if the differences are reasonably well behaved. With only five pairs, inspect the individual changes and avoid making a strong general claim.
The example does not show that practice caused the increase: there is no comparison group, and other changes could explain the scores. Method choice does not replace good study design.
Checks before reporting a result
- Show a plot or summary of the data, not only a p-value.
- Check missing records, outliers, group sizes and whether rows are linked.
- State the estimate and its units; include an interval or uncertainty measure when appropriate.
- Explain the assumptions and any changes made after seeing the data.
- Keep the conclusion within what the design supports; association alone does not establish cause.
NIST’s exploratory data analysis guidance emphasizes using plots and summaries to reveal structure, detect anomalies and check assumptions before fitting a model.
Frequently asked questions
Can I choose a test by checking whether my data are normal?
Normality is only one part of method choice. First identify the question, outcome type, dependence structure and sample design. Then check the assumptions relevant to the method you are considering.
Is a nonparametric test always safer?
No. Nonparametric methods have their own assumptions and answer specific questions, often about ranks or distributions. They are not assumption-free replacements for every parametric method.
What if I have a small sample?
Show the individual observations where possible, describe uncertainty carefully and avoid relying on a test that has little power. There is no universal sample-size cutoff that makes every method valid.
Should I run many tests and report the smallest p-value?
No. Searching many tests and reporting only the smallest can make false positives more likely. Plan primary comparisons in advance or explain how multiple comparisons were handled.
Sources and next steps
- NIST/SEMATECH e-Handbook: Exploratory Data Analysis — plots and methods for understanding data and checking assumptions.
- NIST Handbook 151: Statistical Methods — engineering-oriented references and case studies.