STATISTICAL ANALYSIS · BEGINNER GUIDE
How to Check Residuals After ANOVA
Use residual plots to check whether an ANOVA model leaves patterns that could undermine its conclusions.
Quick answer: ANOVA assumptions concern the model errors, not whether the raw outcome column looks perfectly normal. Check residuals against fitted values and collection order, and use a normal probability plot as one diagnostic among several.
What this method answers
A residual is an observed outcome minus the model’s fitted value. In a one-way ANOVA, the fitted value for a row is its group mean. Residual plots help reveal unequal spread, dependence, unusual observations or a missing pattern.
No diagnostic plot proves every assumption. Consider how observations were sampled and measured, and whether the model design captures repeated or clustered structure. A normality test alone cannot tell you whether the entire model is appropriate.
Before running a calculation, write down the population and the exact quantity you want to estimate. A method name alone does not define the question, the comparison or the assumptions.
Steps to follow
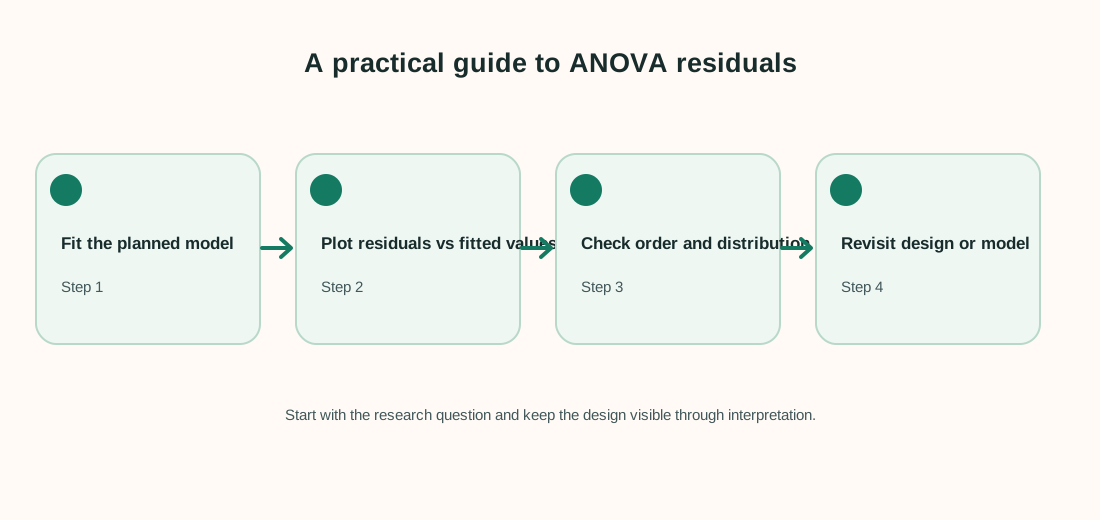
- Calculate fitted values and residuals for every analyzed row.
- Plot residuals against fitted values and group; look for changing spread, curves or isolated points.
- Plot residuals in collection order when order may matter, and use a normal probability plot to inspect distribution shape.
- Explain material departures and consider a model or analysis aligned with the data-generating design.
Keep a record of exclusions, recoding decisions and software settings. That makes the analysis easier to check and repeat.
Worked example
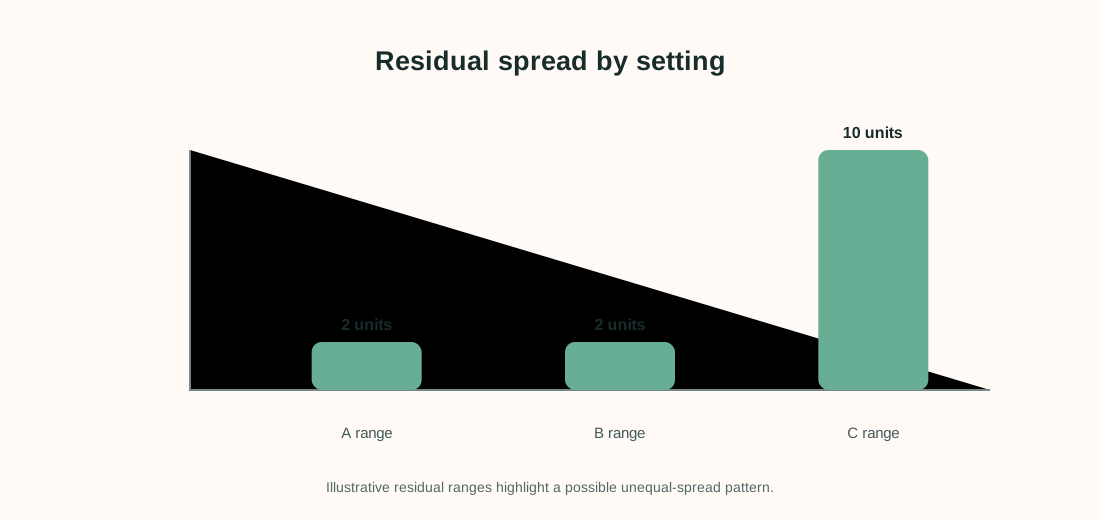
Suppose three machine settings are compared. The group means fit the simple values below, but the residual spread is very different by setting.
| Setting | Residuals (illustrative) |
|---|---|
| A | −1, 0, +1 |
| B | −1, 0, +1 |
| C | −5, 0, +5 |
The residual ranges are 2, 2 and 10 units. This does not automatically invalidate every possible analysis, but it is a clear cue to examine unequal variance and the influence of group C. The point is visible in a plot before relying on one omnibus p-value.
Interpret the result carefully
Residual checks are a model check, not a way to delete inconvenient observations until the assumptions look good. Investigate data errors, report justified exclusions and use a suitable alternative if the model is a poor description.
Limit to keep in mind: With very small groups, residual plots have little power to reveal problems. Study design and measurement knowledge remain important.
When reporting an analysis, include the sample size, estimate, units and uncertainty. Explain why the method fits the sampling and measurement design. Separate planned tests from exploratory checks, and avoid saying that association proves a cause.
Frequently asked questions
Should I test normality on the raw scores?
Model assumptions usually concern errors or residuals. Inspect plots and the design instead of treating a raw-data normality test as a pass/fail gate.
What does a funnel shape suggest?
It can indicate that residual variability changes with fitted values or groups. Consider the measurement process and a model that handles unequal variance.
Can one outlier make ANOVA invalid?
An unusual point deserves investigation, but it is not automatically an error. Check its source, influence and effect on the conclusion.
Should I remove non-normal residuals?
No. Do not remove valid records just to force a preferred plot. Explain the issue and use a defensible analysis.