QUANTITATIVE ANALYSIS · BEGINNER GUIDE
One-Way ANOVA by Hand: A Small Worked Example
Follow a small one-way ANOVA calculation from group means to sums of squares, degrees of freedom and the F ratio.
Quick answer: A one-way ANOVA separates the total variation into variation between group means and variation within groups. Divide each sum of squares by its degrees of freedom, then divide the between-group mean square by the within-group mean square to get F.
What this method answers
This hand calculation is useful for learning what an ANOVA table contains. In practice, software reduces arithmetic mistakes, but you still need to know which observations belong in the analysis and whether the model fits the study.
The null hypothesis says all population group means are equal. A large F value means the observed group means are spread out relative to within-group noise. A significant result says at least one mean differs; it does not identify which pair differs.
Before running a calculation, write down the population and the exact quantity you want to estimate. A method name alone does not define the question, the comparison or the assumptions.
Steps to follow
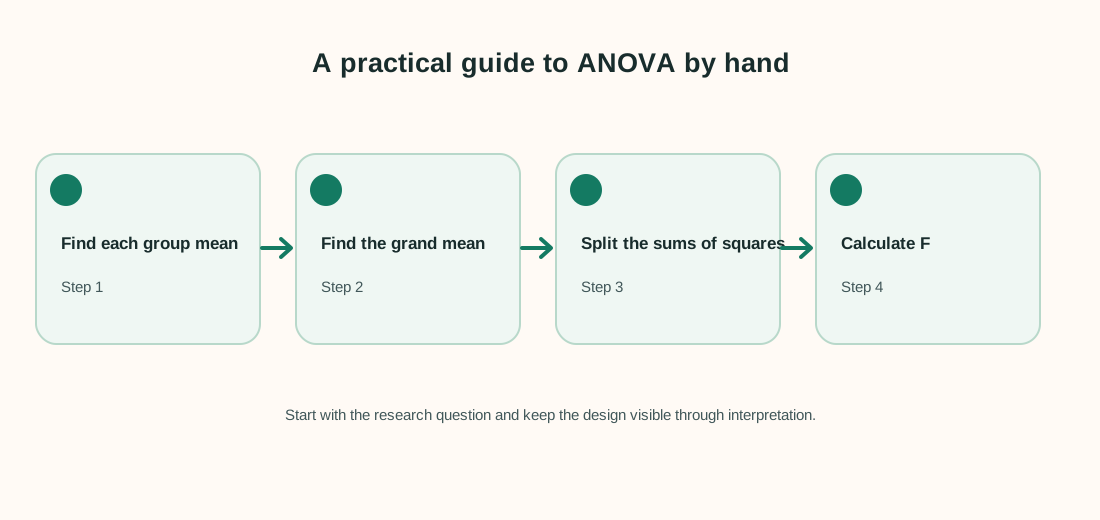
- Calculate the mean within each group and the grand mean across all observations.
- Compute between-group sum of squares from group sizes and distance of each group mean from the grand mean.
- Compute within-group sum of squares from each observation’s distance from its group mean.
- Use df between = k − 1 and df within = N − k, then form F = MS between ÷ MS within.
Keep a record of exclusions, recoding decisions and software settings. That makes the analysis easier to check and repeat.
Worked example
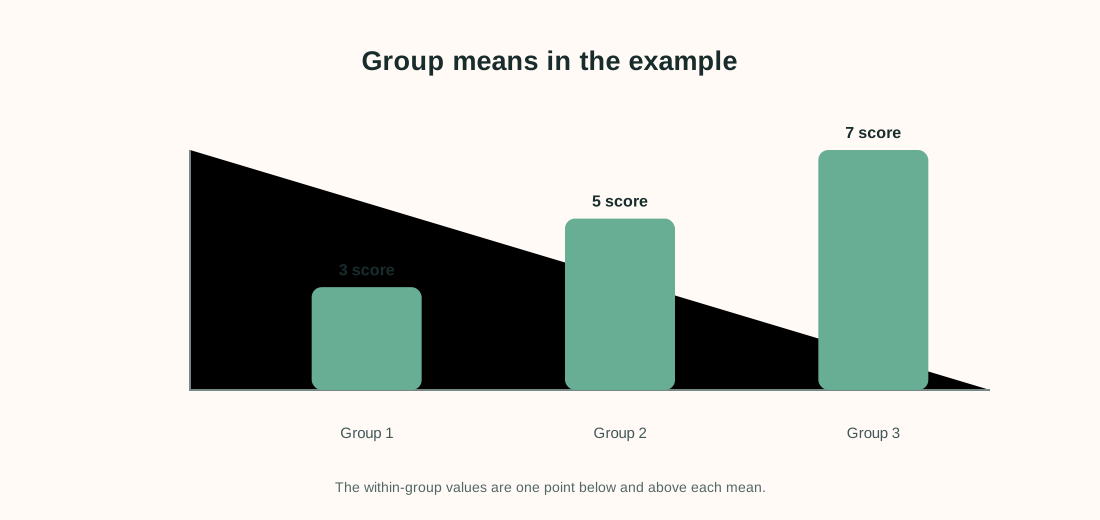
Three small groups have scores [2, 4], [4, 6] and [6, 8]. Each group contains two observations, for N = 6 total observations.
| Group 1 | Group 2 | Group 3 |
|---|---|---|
| 2 | 4 | 6 |
| 4 | 6 | 8 |
The group means are 3, 5 and 7; the grand mean is 5. Between-group SS = 2(3−5)² + 2(5−5)² + 2(7−5)² = 16. Within-group SS = (2−3)²+(4−3)², plus the same two squared deviations for each other group, which totals 6. Degrees of freedom are 3−1 = 2 and 6−3 = 3. So MS between = 16/2 = 8, MS within = 6/3 = 2, and F = 8/2 = 4.
Interpret the result carefully
This F ratio describes how the between-group variation compares with the within-group variation in this constructed sample. To decide statistical significance, compare it with the appropriate F distribution using the chosen significance level and degrees of freedom.
Limit to keep in mind: Do not infer a p-value from F alone without its degrees of freedom. These six values are intentionally simple and are not evidence about a real process.
When reporting an analysis, include the sample size, estimate, units and uncertainty. Explain why the method fits the sampling and measurement design. Separate planned tests from exploratory checks, and avoid saying that association proves a cause.
Frequently asked questions
Why divide sums of squares by degrees of freedom?
The resulting mean squares put the variation estimates on a comparable per-degree-of-freedom scale.
Does F = 4 mean the groups differ?
Not by itself. The reference F distribution and its degrees of freedom are needed to assess the result.
Does a significant ANOVA show every group differs?
No. It indicates evidence that not all means are equal. Planned contrasts or adjusted pairwise comparisons answer more specific questions.
Can I do this with unequal group sizes?
Yes, many ANOVA models allow unequal sizes, but the design and sums-of-squares convention need careful handling.