STATISTICAL METHODS · BEGINNER GUIDE
Two-Way ANOVA Interaction: A Simple Example
Understand a two-way ANOVA interaction by comparing how one factor’s effect changes across levels of another factor.
Quick answer: An interaction means that the difference associated with one factor changes across the levels of another factor. In a two-way ANOVA, inspect the cell means and interaction plot before interpreting either factor’s average effect.
What this method answers
A two-factor design records combinations of two factors, such as treatment and temperature. The model can estimate each factor’s main effect and their interaction, depending on the design and model terms.
If there is a strong interaction, summarizing one factor with a single average difference can hide important variation. Describe the effect within relevant levels, while remembering that a plot of means is descriptive and uncertainty needs replicate observations.
Before running a calculation, write down the population and the exact quantity you want to estimate. A method name alone does not define the question, the comparison or the assumptions.
Steps to follow
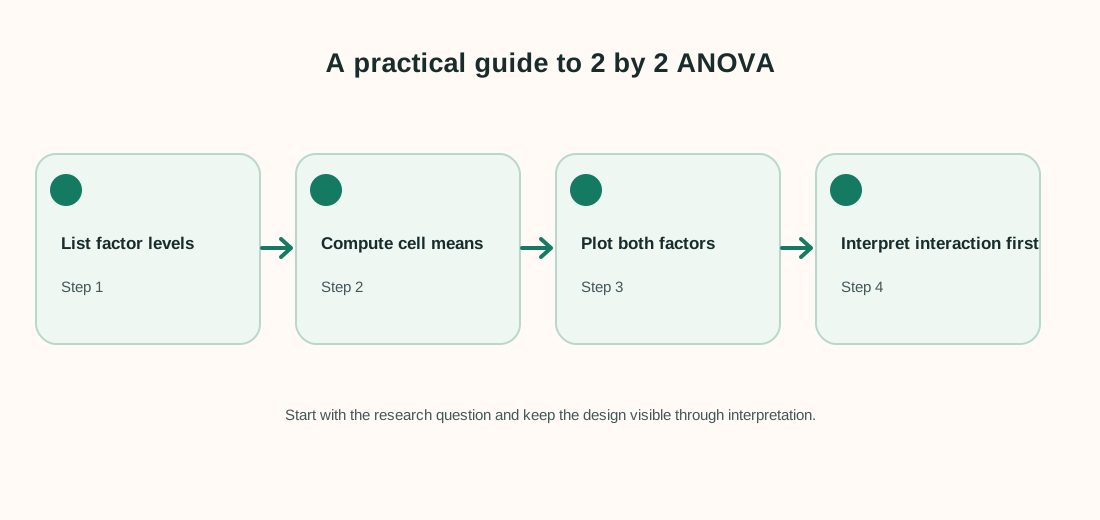
- Write down the levels of both factors and the outcome being measured.
- Calculate a mean for every factor combination, keeping sample sizes visible.
- Plot the cell means and compare the gaps between factor levels.
- Fit the planned model and report interaction estimates with uncertainty before simplifying to main effects.
Keep a record of exclusions, recoding decisions and software settings. That makes the analysis easier to check and repeat.
Worked example
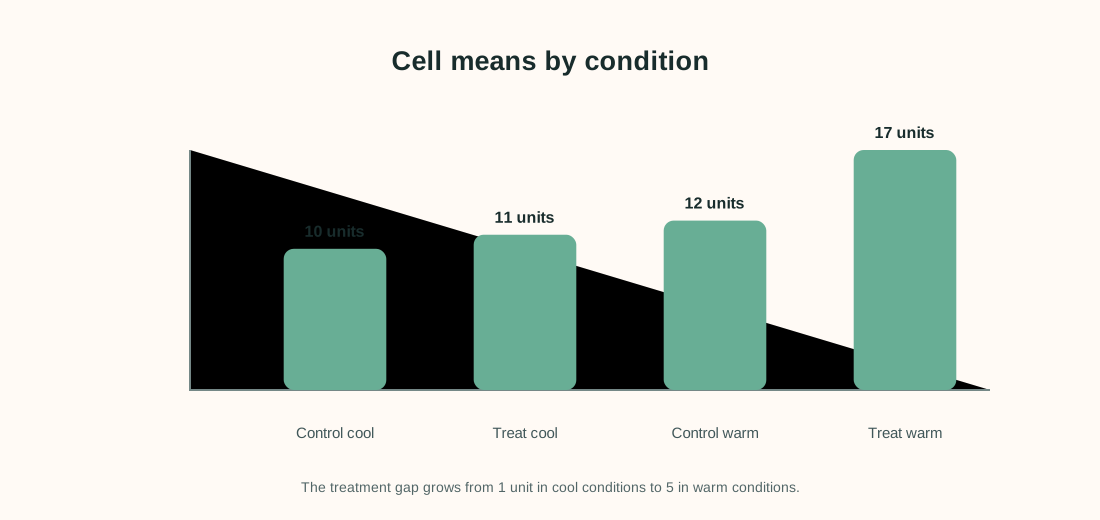
A small experiment compares a treatment and a control under cool and warm conditions. The table contains invented cell means only; there are no replicate-level values here.
| Condition | Cool mean | Warm mean |
|---|---|---|
| Control | 10 | 12 |
| Treatment | 11 | 17 |
The treatment-control difference is 11−10 = 1 under cool conditions and 17−12 = 5 under warm conditions. The difference-in-differences is 5−1 = 4 outcome units. That changing gap is the interaction pattern to investigate.
Interpret the result carefully
The example suggests the treatment contrast may depend on temperature. It cannot tell whether the interaction is statistically reliable because sample sizes and within-cell variability were not supplied.
Limit to keep in mind: Do not claim an interaction from cell means alone. Use the design’s uncertainty estimate, and ensure the study has replication in the cells needed to estimate error.
When reporting an analysis, include the sample size, estimate, units and uncertainty. Explain why the method fits the sampling and measurement design. Separate planned tests from exploratory checks, and avoid saying that association proves a cause.
Frequently asked questions
What does “no interaction” mean?
It means the modeled effect of one factor is constant across the other factor’s levels on the model’s chosen scale.
Should I interpret main effects when interaction is present?
You can report them, but explain that they average across levels and may hide different conditional effects.
Can I make an interaction plot without fitting ANOVA?
Yes. A plot is a useful descriptive check, but it does not replace uncertainty analysis.
What if cell sizes are unequal?
The model can still be fitted, but interpretation depends on design, missing cells and the chosen sums-of-squares or contrast setup.