STATISTICS GUIDE · MODEL SETUP
Multiple dependent variables and one independent variable
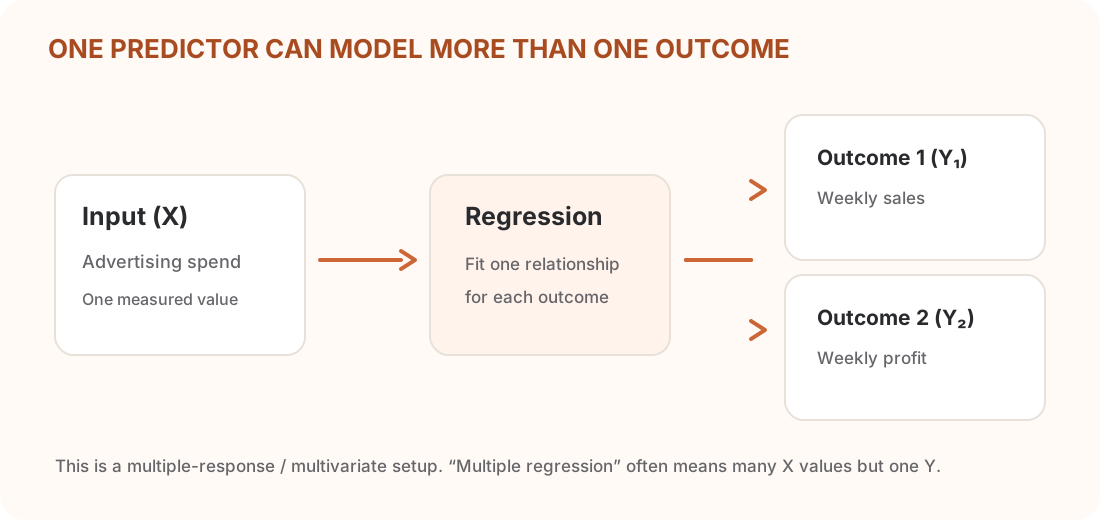
Yes, one predictor can be used with several outcomes. The setup is usually described as a multivariate or multiple-response regression. It is different from “multiple linear regression,” which commonly means several predictors and one outcome.
Quick answer: if one input predicts two numeric outcomes, such as sales and profit, you have one predictor and multiple responses. In R, lm(cbind(y1, y2) ~ x) fits a linear model for both response columns.
Do not mix up the variable counts
| Setup | Predictors (X) | Outcomes (Y) | Common name |
|---|---|---|---|
| One input and one outcome | 1 | 1 | Simple linear regression |
| Several inputs and one outcome | 2 or more | 1 | Multiple linear regression |
| One or more inputs and several outcomes | 1 or more | 2 or more | Multivariate / multiple-response regression |
Names vary a little between fields and software. The safest way to describe your model is to state the number of predictor columns and outcome columns. In this guide’s example, there is one predictor and two outcomes.
Worked example in R
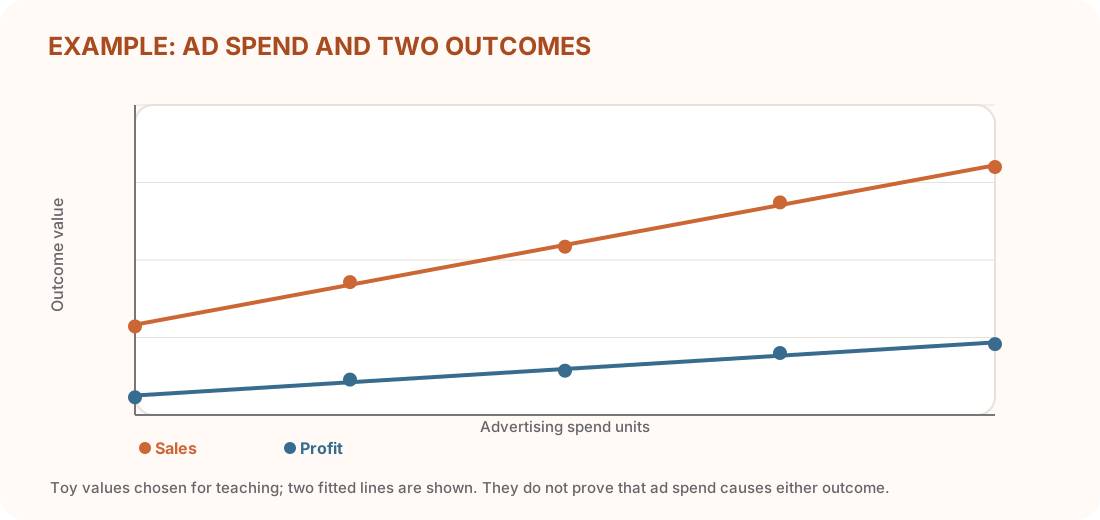
Suppose a small shop records advertising spend, weekly sales and weekly profit. The input is advertising spend; the two responses are sales and profit. These five rows are invented for learning, not for a business decision.
| Ad spend units | Sales | Profit |
|---|---|---|
| 1 | 10 | 2 |
| 2 | 15 | 4 |
| 3 | 19 | 5 |
| 4 | 24 | 7 |
| 5 | 28 | 8 |
shop <- data.frame(
  ad_spend = c(1, 2, 3, 4, 5),
  sales = c(10, 15, 19, 24, 28),
  profit = c(2, 4, 5, 7, 8)
)

fit <- lm(cbind(sales, profit) ~ ad_spend, data = shop)
coef(fit)

predict(fit, newdata = data.frame(ad_spend = 6))
In this tiny example, the fitted lines are approximately sales = 5.7 + 4.5 × ad_spend and profit = 0.7 + 1.5 × ad_spend. At an input of 6, the fitted values are about 32.7 and 9.7. These are model estimates beyond the observed input range, so treat them as extrapolations, not reliable business forecasts.
What does the R model fit?
R’s lm() accepts a matrix response. The official R documentation says it fits least-squares models separately to each response column. That means this command gives you two fitted equations that share the same predictor. It does not automatically model a special relationship between sales and profit errors.
If your research question depends on whether the outcomes move together after accounting for the predictor, or on a joint test across outcomes, use a method designed for multivariate inference and state its assumptions. Two separate fitted lines can be useful for prediction or description, but they do not answer every joint question.
How this differs from RegressionTester’s multiple regression calculator
The multiple linear regression calculator takes several numeric predictors for one outcome. This guide describes one predictor with several outcomes. The variable counts are reversed, so the calculator is not a direct replacement for the R example.
Also, a fitted relationship does not prove that ad spend caused a change in sales or profit. Other factors may affect all three values. A useful analysis needs a sound study design, enough observations and a validation plan.
Frequently asked questions
What is the model called when there are multiple dependent variables?
It is often called multivariate regression or multiple-response regression. The exact name can vary by textbook, so also report how many predictor and response variables you modeled.
Is this the same as multiple linear regression?
Usually, no. Multiple linear regression commonly means several predictors and one response. Multiple-response regression has several response variables; it may have one predictor or several.
Can one independent variable predict two outcomes in R?
Yes. For numeric outcomes, base R’s lm(cbind(y1, y2) ~ x, data = ...) accepts a matrix response and fits the response columns.
Does R’s lm() model the link between the two outcomes?
For a matrix response, R documents separate least-squares fits for each response column. Use a multivariate method when joint outcome structure is part of the question.
Sources and related guides
- R documentation: Fitting linear models — response matrices are fitted separately by least squares.
- An Introduction to R, Chapter 11 — model formulas and linear models in R.