STATISTICS GUIDE · OUTPUT EXPLAINED
How to read a linear regression summary
A regression summary can show coefficients, uncertainty, model fit and more. This guide explains the main rows with a small Python example and points out what the numbers cannot prove.
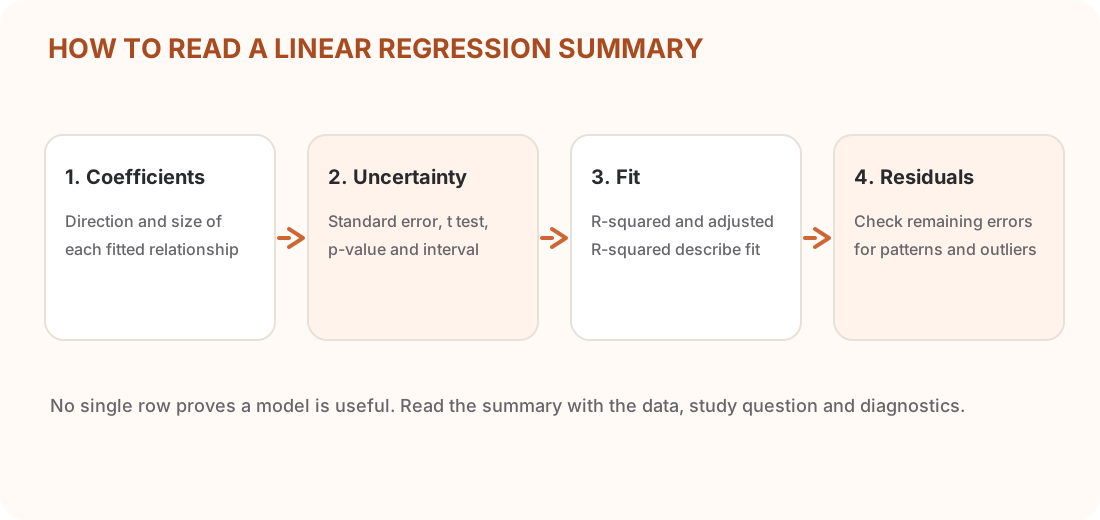
Quick answer: read the coefficient table to understand the fitted relationships, then check model fit and residuals. A small p-value or high R-squared alone does not show that your model is correct or useful on new data.
Worked example with Python and statsmodels
Suppose a small practice exercise records practice hours and quiz scores. The data below are invented for explanation. Five rows are far too few to make a dependable real-world conclusion.
import pandas as pd
import statsmodels.api as sm

data = pd.DataFrame({
    "practice_hours": [1, 2, 3, 4, 5],
    "quiz_score": [3, 5, 5, 7, 10],
})

X = sm.add_constant(data["practice_hours"])
fit = sm.OLS(data["quiz_score"], X).fit()

print(fit.summary())
print(fit.params)
print("R-squared:", fit.rsquared)
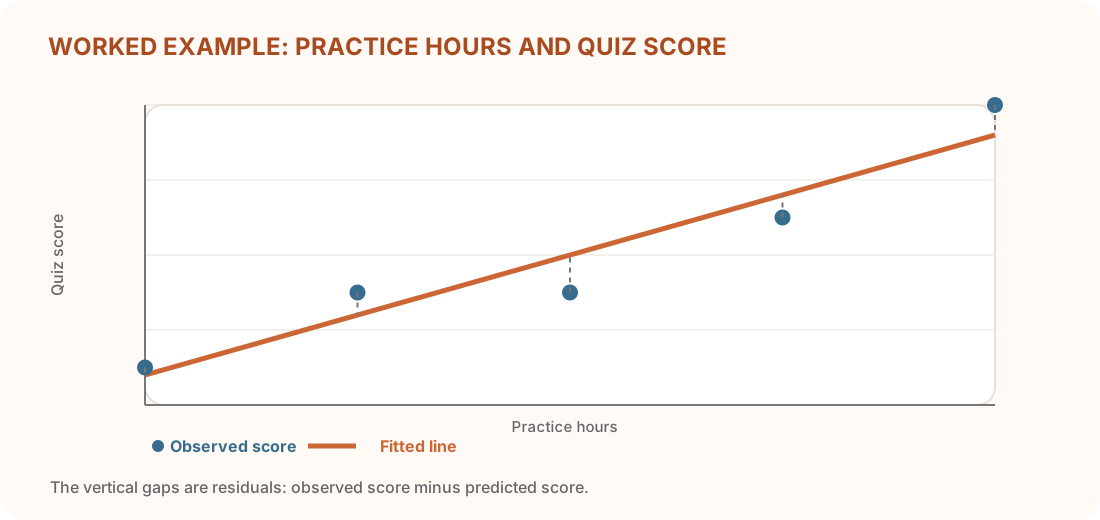
For these values, the fitted intercept is 1.2, the practice-hours coefficient is 1.6, and R-squared is about 0.914. The line is predicted score = 1.2 + 1.6 × practice hours. Those values describe this tiny sample only.
What the summary numbers mean
| Summary item | Plain-language meaning | Careful interpretation |
|---|---|---|
| Coefficient | The fitted change in the outcome for a one-unit input change, with other inputs held fixed in a multiple-input model. | The slope here is 1.6 score points per practice hour in the fitted line. It does not prove practice caused the score change. |
| Intercept | The fitted outcome when every numeric input is zero. | Zero hours is outside this sample’s 1–5 hour range, so the intercept may have little practical meaning. |
| Standard error and confidence interval | How uncertain the coefficient estimate is under the model’s assumptions. | A narrow interval is not a guarantee that the model assumptions or study design are sound. |
| t-statistic and p-value | A test of a coefficient against a specified null value, often zero. | A p-value is not the probability that the coefficient is true or that the model is correct. |
| R-squared | How much of the outcome variation in this sample is accounted for by the fitted model. | It does not measure causality and does not by itself show performance on new data. |
| Adjusted R-squared | A version of R-squared that accounts for the number of fitted terms. | It can help compare related models on the same response, but it is not a substitute for test data. |
In a statsmodels table, coef is the estimate, std err is its standard error, t is the test statistic, and P>|t| is the two-sided p-value for the coefficient test. The interval columns show a confidence interval under the fitted model’s assumptions.
Check the residuals before trusting the fit
A residual is the observed outcome minus the fitted outcome. In the chart, the vertical dashed gaps show residuals. A residual plot with no clear pattern is one useful check. Curves, a fan-shaped spread, time order, or a few very large gaps can point to problems that the summary table alone will not explain.
Also check how the data were collected, whether observations are independent, whether important inputs are missing, and how the model performs on held-out data. The residual plot tool and R-squared calculator can help inspect separate pieces of a model report.
Frequently asked questions
What does the coefficient mean in a linear regression summary?
It is the fitted change in the outcome for a one-unit change in that input, holding other modeled inputs fixed. Whether that is a causal effect depends on the study design and assumptions.
Does a high R-squared mean the model is good?
Not by itself. It describes fit to the analyzed data. Check residuals, use a metric suited to your question, and evaluate predictions on data that was not used to fit the model.
Does a small p-value prove my predictor matters?
It is evidence against a particular null hypothesis under the model assumptions. It does not prove a causal effect, show practical importance, or guarantee that the model will generalize.
Why does statsmodels need add_constant()?
statsmodels.OLS does not add an intercept automatically. sm.add_constant() adds a column of ones so the model can estimate an intercept. Other libraries may handle this differently.
Sources and related guides
- statsmodels: OLS — model fitting and summary output.
- R documentation: Summarizing linear model fits — coefficient statistics and R-squared definitions.
- statsmodels: Model fit and summary — a complete OLS workflow.