STATISTICAL RESEARCH · BEGINNER GUIDE
Statistical Power, Effect Size and Sample Size
Learn how sample size, variability and the effect you care about work together when planning a study.
Quick answer: Power is the chance a planned test detects a specified effect when that effect is present. It generally increases with sample size and effect size, and decreases as variability rises, all else equal.
What this method answers
Power calculations require a test, alpha level, target power, expected variability and a smallest effect worth detecting. Choosing these inputs from desired headlines after the analysis reverses the planning process.
Plan power before collecting data. Use prior studies, pilot data or a meaningful decision threshold for effect size and variability, then check whether recruitment and design can meet the target.
Before running a calculation, write down the population and the exact quantity you want to estimate. A method name alone does not define the question, the comparison or the assumptions.
Steps to follow
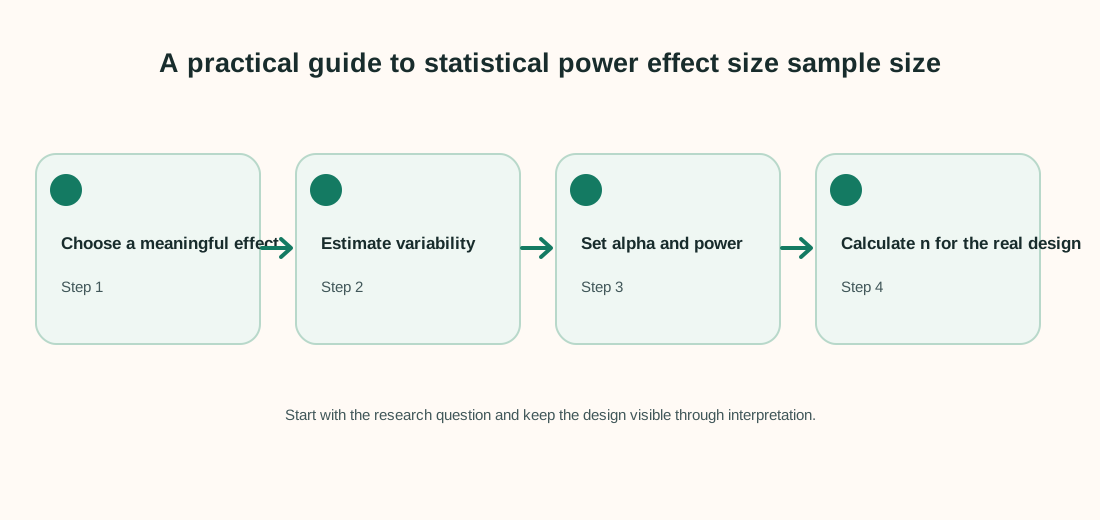
- Define the smallest difference that would change a decision.
- Estimate variation from relevant data and document uncertainty in that estimate.
- Choose alpha, target power, sidedness and allocation.
- Account for clustering, attrition, repeated measures and planned multiplicity before calculating sample size.
Keep a record of exclusions, recoding decisions and software settings. That makes the analysis easier to check and repeat.
Worked example
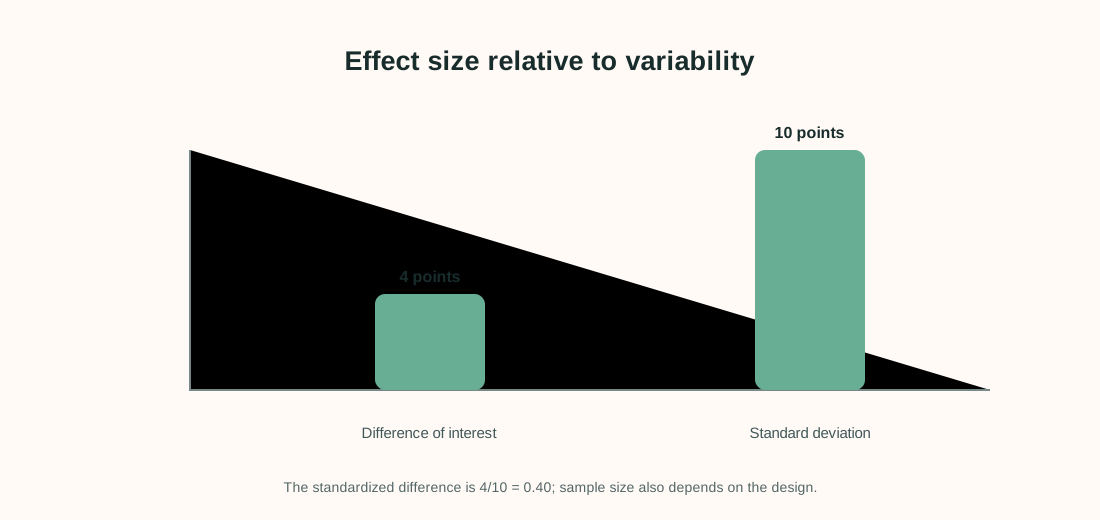
A team wants to detect a 4-point difference in a score with SD about 10 points, two-sided α=0.05 and 80% target power. Exact sample size depends on the test and design.
| Planning input | Example value |
|---|---|
| Smallest effect of interest | 4 points |
| Standard deviation | 10 points |
| Alpha | 0.05 |
| Target power | 0.80 |
The standardized effect for this simple two-group illustration is 4/10=0.40 SD. A sample-size calculation then uses that effect, the chosen test, alpha, power and allocation ratio; the ratio alone is not enough to produce n.
Interpret the result carefully
If resources only allow a smaller sample, report the resulting precision and treat the study as exploratory or estimation-focused rather than promising a 80% chance for every possible effect.
Limit to keep in mind: Power calculations are only as credible as their assumptions. Underestimated variability, attrition, clustering or multiple primary outcomes can reduce achieved power.
When reporting an analysis, include the sample size, estimate, units and uncertainty. Explain why the method fits the sampling and measurement design. Separate planned tests from exploratory checks, and avoid saying that association proves a cause.
Frequently asked questions
Does 80% power guarantee a result?
No. It describes a repeated-study probability under the specified effect and assumptions.
Does doubling n double power?
Not generally. Power depends nonlinearly on the test, variance, effect and sample size.
Can I calculate power after the study?
Post-hoc power based on the observed effect adds little beyond the p-value; report the estimate and interval instead.
What if I cannot recruit enough people?
Report the precision you can achieve and interpret null findings cautiously.