DATA MINING · PRACTICAL METHODS
Statistical methods in data mining
Data mining searches a dataset for patterns that may help answer a question. Statistics helps describe how common a pattern is, compare it with a baseline and check how much confidence to place in it.
Quick answer: define the question, prepare the data, choose a method that matches the pattern you want to find, and validate the result on suitable data. A discovered association is not proof that one event causes another, and a pattern found after searching many possibilities needs careful confirmation.
Common statistical method families
- Descriptive summaries: counts, proportions, means, quantiles and plots describe the dataset before modeling.
- Classification: supervised models learn to predict a known category, such as whether a transaction is flagged. Use a train/test plan and metrics that fit the costs of errors.
- Regression: models estimate or predict a numeric outcome, such as demand, while residual checks reveal where a simple model may fail.
- Clustering: unsupervised methods organize observations by a chosen similarity rule when there is no target label.
- Association rules: frequent-pattern methods find items or events that tend to occur together, such as products appearing in the same baskets.
- Anomaly detection: methods rank observations that differ from an expected pattern. An unusual record can be an error, a rare valid event or a sign of a change.
These methods answer different questions. A high-scoring pattern is not automatically useful: check how it was selected, how it performs on new data and whether acting on it is sensible.
A practical data-mining workflow
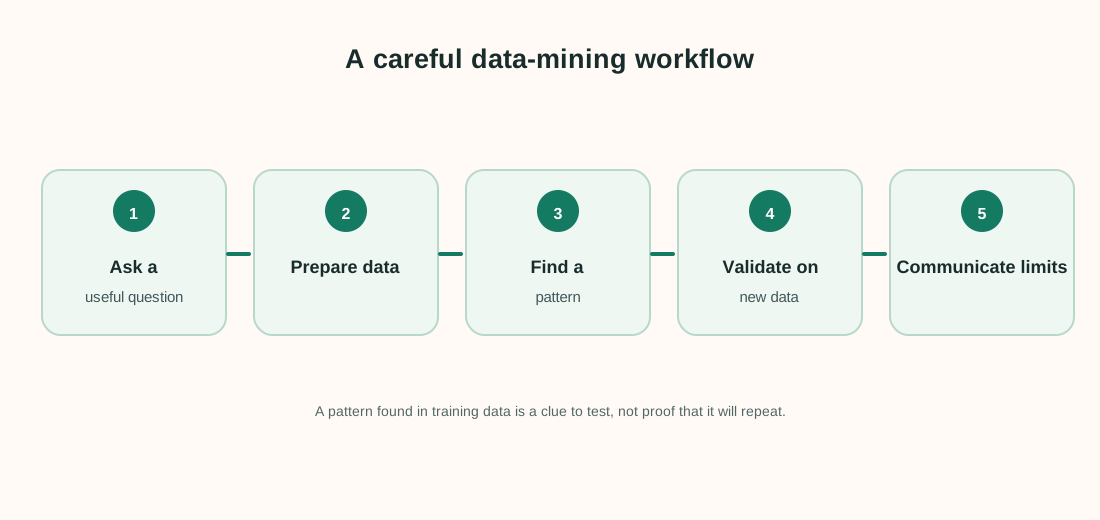
- Define a decision or learning question. Write down what the result will help someone understand or decide.
- Record where the data came from. Note the population, time period, collection process, missingness and known limits.
- Prepare data without leaking future information. Remove duplicates carefully, document transformations and keep a final holdout set untouched during feature and method selection.
- Start with a simple baseline. Compare complex patterns with simple summaries or an easy-to-explain model.
- Search and measure patterns. Use a metric with a clear definition; report counts and denominators as well as percentages.
- Validate and monitor. Check the pattern on data not used to discover it and revisit it when the process or population changes.
Worked example: bread and milk
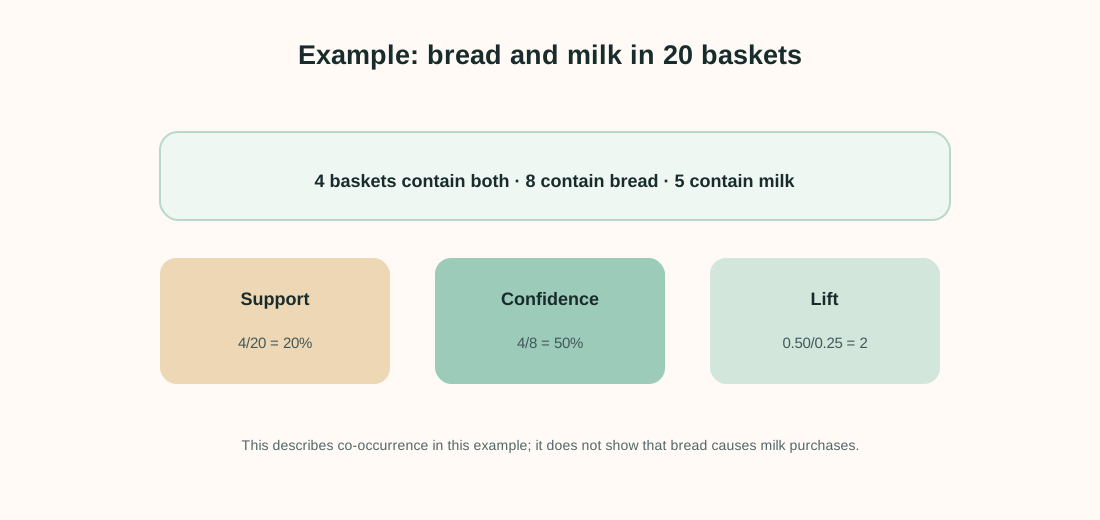
Suppose there are 20 toy shopping baskets. Bread appears in 8 baskets, milk in 5, and both appear together in 4. For the rule “bread → milk”:
- Support is 4 ÷ 20 = 0.20, because 20% of all baskets contain both items.
- Confidence is 4 ÷ 8 = 0.50, because half of the bread baskets also contain milk.
- Lift is 0.50 ÷ (5 ÷ 20) = 2. Milk appears twice as often among bread baskets as in all baskets in this toy dataset.
These values are descriptive. They do not show that buying bread causes someone to buy milk. The dataset is also tiny: one extra basket would change the percentages a lot. In a real analysis, show counts, use a large enough dataset, account for season and other relevant structure, and validate the association on a later or held-out sample.
Avoid false discoveries and data leakage
When analysts test many variables, subgroups, time windows and thresholds, some patterns will look strong by chance. Keep a record of the searches you ran, distinguish planned questions from exploratory findings and confirm interesting discoveries with new data or a design suited to confirmation.
Data leakage happens when information from outside the training process sneaks into model fitting or evaluation. Examples include scaling all rows before a split, selecting features using the test set or using a value that would not exist at prediction time. A clean split and a pipeline that learns preprocessing from training data help prevent inflated results.
Also question whether a pattern is useful and fair to act on. Data can encode old decisions, uneven measurement or proxy variables. Statistical strength alone cannot settle that decision.
Frequently asked questions
Is data mining the same as machine learning?
They overlap. Data mining is a broad search for useful patterns in data; machine learning provides many methods for prediction and pattern discovery, but the terms are not exact synonyms.
Does a high lift prove that a rule is useful?
No. Check support counts, sample size, stability, business meaning and whether the rule repeats on data not used to find it.
Can data mining prove cause and effect?
Usually not by itself. Observational patterns can be confounded or selected by the search process. Causal questions need a suitable design and assumptions.
Why keep test data separate?
Repeatedly tuning choices against test results makes the test set part of model development. A separate final evaluation helps provide a less biased estimate of performance.
Sources and next steps
- mlxtend: Association rules — definitions for support, confidence and lift.
- scikit-learn: Common pitfalls and recommended practices — data leakage, preprocessing and evaluation.
- scikit-learn: Clustering — unsupervised grouping methods and evaluation.