STATISTICAL RESEARCH · BEGINNER GUIDE
Statistical Analysis in Research Methodology: A Clear Plan
Connect research questions, variables, sampling and statistical methods in a practical analysis plan.
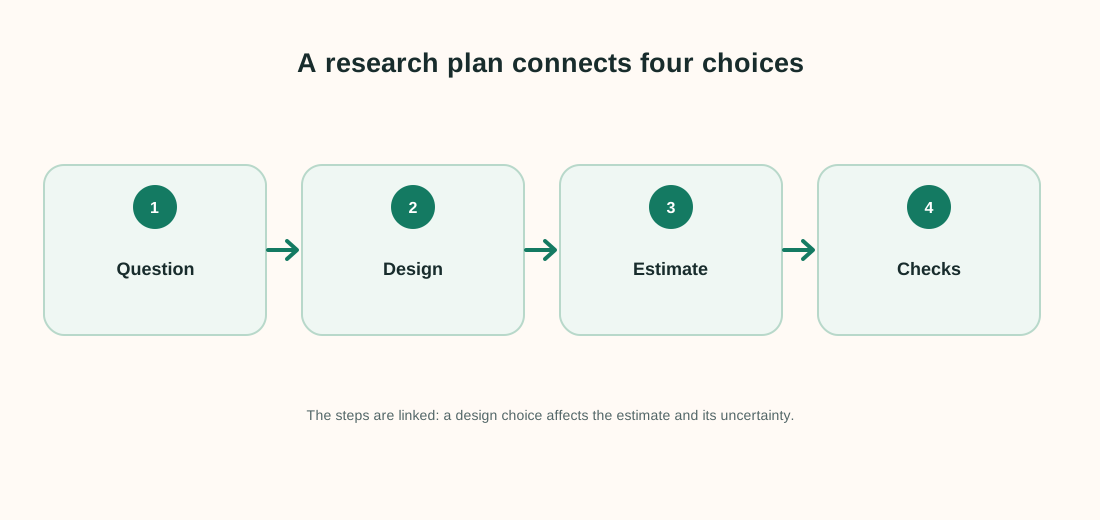
Quick answer: A good analysis plan starts with the research question and study design, not a list of tests. Define the outcome, predictors, target population, sampling process and comparison before choosing a statistical method.
What this method answers
Research methodology describes how evidence is collected and analyzed. The statistical method must fit the measurement scale and how observations were selected or linked.
For a descriptive question, a clear table or plot may answer more than a significance test. For a comparison or prediction question, choose a model and state the estimand, assumptions and missing-data plan before examining results.
Before running a calculation, write down the population and the exact quantity you want to estimate. A method name alone does not define the question, the comparison or the assumptions.
Steps to follow
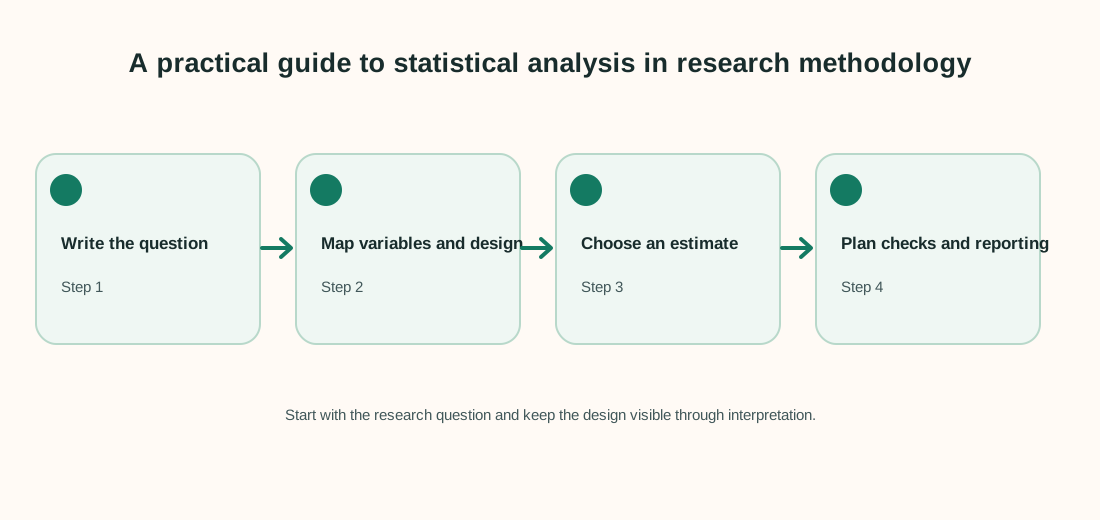
- State the population, exposure or group, outcome and time period.
- Classify each variable and identify paired, clustered or repeated observations.
- Choose the primary estimate and a method that matches the design.
- Prespecify missing-data handling, diagnostics, sensitivity checks and clear reporting tables.
Keep a record of exclusions, recoding decisions and software settings. That makes the analysis easier to check and repeat.
Worked example
A school researcher asks whether a new reading schedule is associated with weekly reading time. Students are measured in several classrooms.
| Research element | Example |
|---|---|
| Population | Grade 8 students in participating schools |
| Outcome | Minutes read per week |
| Exposure | New schedule or usual schedule |
| Design feature | Students grouped by classroom |
If the adjusted average difference is 18 minutes per week, explain the unit and uncertainty, and account for classroom grouping. Treating every student as fully independent can make standard errors too small when classmates share conditions.
Interpret the result carefully
The estimate is an association unless the design supports a causal claim. If classrooms were not randomly assigned, students or teachers may differ in other ways that also affect reading time.
Limit to keep in mind: A statistical method cannot repair a design that did not measure important variables or include the comparison needed for the question.
When reporting an analysis, include the sample size, estimate, units and uncertainty. Explain why the method fits the sampling and measurement design. Separate planned tests from exploratory checks, and avoid saying that association proves a cause.
Frequently asked questions
Do I need a hypothesis test for every research question?
No. Descriptive estimates, plots and intervals may be more useful. Use a test when it answers a planned inferential question.
Can I select a test after analyzing the data?
Exploratory analysis is useful, but label it exploratory and confirm important findings with a suitable plan or new data.
Why define the population?
It says who the result is intended to describe and helps readers judge whether the sample supports that claim.
Does statistical significance prove causation?
No. Causal claims depend on design and assumptions, not just a p-value.