STATISTICAL METHODS · BEGINNER GUIDE
Spearman vs Pearson Correlation: Which One Fits?
Choose Pearson or Spearman correlation by checking linearity, rank order, measurement scale and outliers.
Quick answer: Pearson correlation measures the strength and direction of a linear relationship between numeric variables. Spearman correlation measures the strength of a monotonic relationship using ranks, so it can capture consistently increasing or decreasing patterns that are not linear.
What this method answers
Pearson can be strongly affected by influential outliers and curved relationships. Spearman is based on ranks and is less tied to numeric spacing, but it can still be affected by unusual rank patterns and does not make association causal.
Plot the data first. Choose Pearson for a meaningful linear relationship and Spearman when a monotonic rank relationship or ordinal scale is the target. Neither summarizes every possible nonlinear pattern.
Before running a calculation, write down the population and the exact quantity you want to estimate. A method name alone does not define the question, the comparison or the assumptions.
Steps to follow
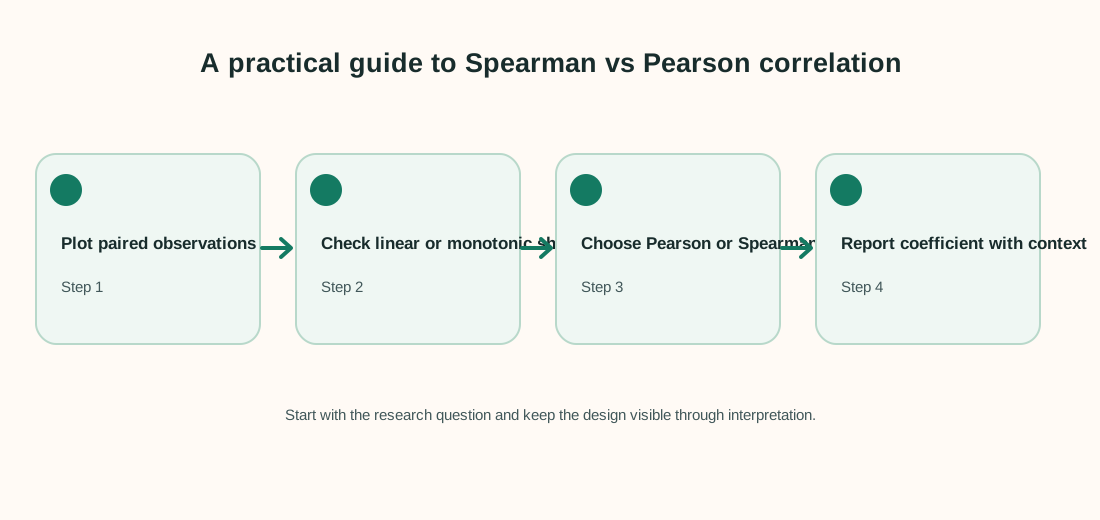
- Make a scatterplot and note outliers or subgroups.
- Decide whether a straight-line or rank-order relationship is the target.
- Calculate the matching coefficient and its uncertainty or test.
- Explain that correlation describes association, not cause.
Keep a record of exclusions, recoding decisions and software settings. That makes the analysis easier to check and repeat.
Worked example
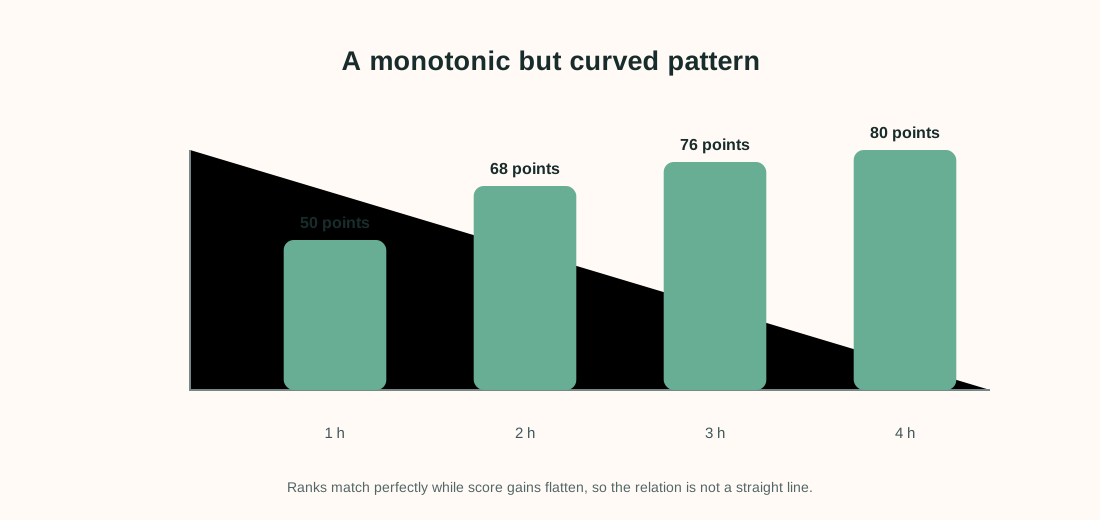
Study time rises from 1 to 4 hours while quiz score rises from 50 to 80, but the score gains are larger early and flatten later.
| Hours | Score |
|---|---|
| 1 | 50 |
| 2 | 68 |
| 3 | 76 |
| 4 | 80 |
The observations have the same rank order in both variables, so Spearman’s rank correlation is 1 for this perfectly monotonic toy sequence. Pearson will be below 1 because the increments do not follow an exact straight line.
Interpret the result carefully
The two measures summarize different shapes. Inspect a scatterplot and report a coefficient that matches the relationship and question; a high coefficient does not show that more study time caused the score pattern.
Limit to keep in mind: Correlation can miss curved or non-monotonic dependence and may be driven by a subgroup. Report the sample, plot and uncertainty when the conclusion matters.
When reporting an analysis, include the sample size, estimate, units and uncertainty. Explain why the method fits the sampling and measurement design. Separate planned tests from exploratory checks, and avoid saying that association proves a cause.
Frequently asked questions
Does Spearman require normally distributed data?
It does not rely on the same linear-normal assumptions as a conventional Pearson inference, but design and dependence still matter.
Can Pearson detect a curved relationship?
It may be small for a strong curve that is not linear. Plot the data.
Is Spearman immune to outliers?
No. Ranking changes some sensitivity, but unusual cases can still affect ranks and conclusions.
Does a correlation prove causation?
No. Confounding, reverse direction and selection can produce associations.