STATISTICAL METHODS · BEGINNER GUIDE
Regression for Prediction vs Explanation
Learn why prediction accuracy and explaining relationships are different goals, with a small linear-regression example.
Quick answer: A predictive model is judged by how well it predicts unseen cases. An explanatory model is designed to estimate and interpret relationships under a stated model. A model can perform well at one goal and poorly at the other.
What this method answers
Prediction focuses on future or held-out outcomes. Validation should mimic the way the model will be used, and preprocessing must be learned without using test data.
Explanation focuses on what model parameters mean under assumptions about measurement, sampling and omitted variables. A regression coefficient is not automatically a causal effect; causal interpretation requires a suitable design and assumptions.
Before running a calculation, write down the population and the exact quantity you want to estimate. A method name alone does not define the question, the comparison or the assumptions.
Steps to follow
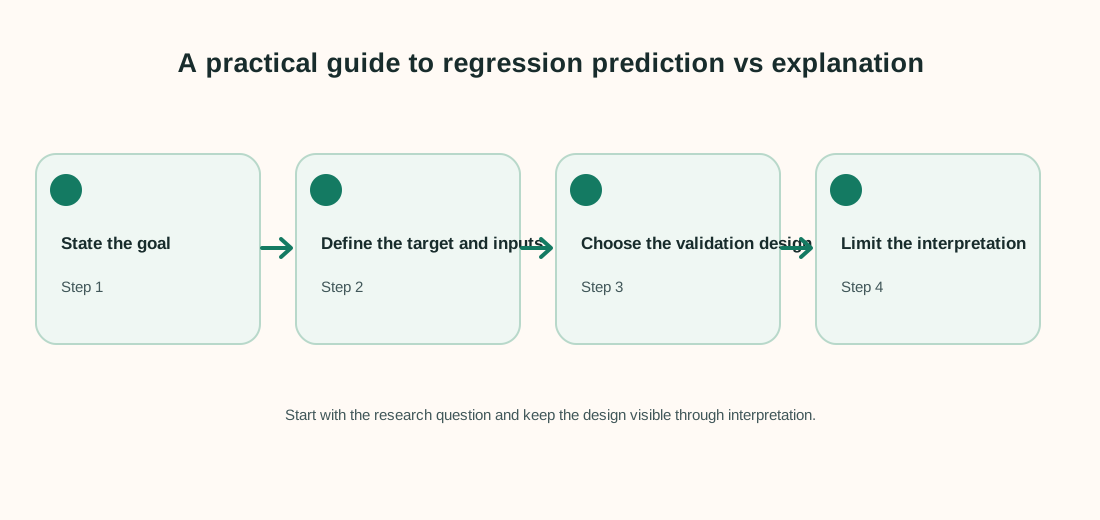
- Write whether the priority is accurate prediction, estimating an association or estimating a causal effect.
- Select variables that are available at the time of prediction or justified by the explanatory question.
- For prediction, split or resample data to match future use; for explanation, check model and design assumptions.
- Report the outcome scale, error or effect estimate and limits of interpretation.
Keep a record of exclusions, recoding decisions and software settings. That makes the analysis easier to check and repeat.
Worked example
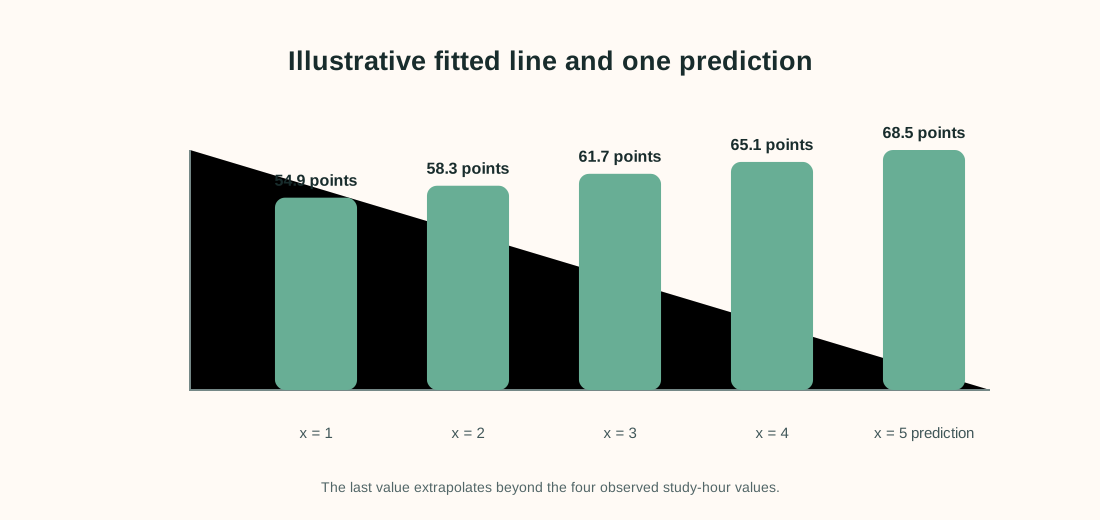
A fictional class records study hours x and quiz score y for four students. Fit an ordinary least-squares line only to illustrate the distinction between a fitted relationship and a causal claim.
| Study hours x | Quiz score y |
|---|---|
| 1 | 55 |
| 2 | 58 |
| 3 | 62 |
| 4 | 65 |
The fitted line is approximately ŷ = 51.5 + 3.4x. It predicts about 68.5 points at five hours. But five hours is just beyond the observed range, and students were not randomly assigned study time, so neither reliable extrapolation nor a causal “3.4 points per hour” claim follows from this four-row example.
Interpret the result carefully
For prediction, test the line on new students and compare its errors with a baseline. For explanation, consider confounders such as prior knowledge and the way study hours were measured.
Limit to keep in mind: A high R² does not prove that an input causes the outcome. A good causal design may also prioritize unbiased effect estimation over out-of-sample prediction.
When reporting an analysis, include the sample size, estimate, units and uncertainty. Explain why the method fits the sampling and measurement design. Separate planned tests from exploratory checks, and avoid saying that association proves a cause.
Frequently asked questions
Can the same regression do both jobs?
Sometimes, but the model choices and evaluation differ. State the primary goal and avoid mixing a predictive score with a causal claim.
Why validate predictions on held-out data?
Training error usually looks optimistic because the model was fitted to those observations. Held-out data estimate performance on new cases more honestly.
Can I use every available predictor?
Not automatically. Some variables may leak future information or create unstable interpretation. Choose inputs that match the intended use.
Does a regression coefficient show causation?
No. It describes a modeled association unless design and assumptions support a causal interpretation.