STATISTICAL METHODS · BEGINNER GUIDE
Categorical Predictors in Regression: Reference Groups
Learn how indicator variables encode categories and how regression coefficients compare each level with a reference group.
Quick answer: A categorical predictor is commonly represented by indicator columns. With an intercept and k categories, k−1 indicators compare each non-reference category with the chosen reference category.
What this method answers
The reference category is part of the coefficient interpretation. Changing it changes the reported coefficients but not the model’s fitted values, as long as the same full category information is represented.
Choose a reference level that makes scientific or practical comparisons easy. For unordered categories, do not assign numbers such as 1, 2 and 3 and treat them as a numeric trend unless that ordering and spacing are defensible.
Before running a calculation, write down the population and the exact quantity you want to estimate. A method name alone does not define the question, the comparison or the assumptions.
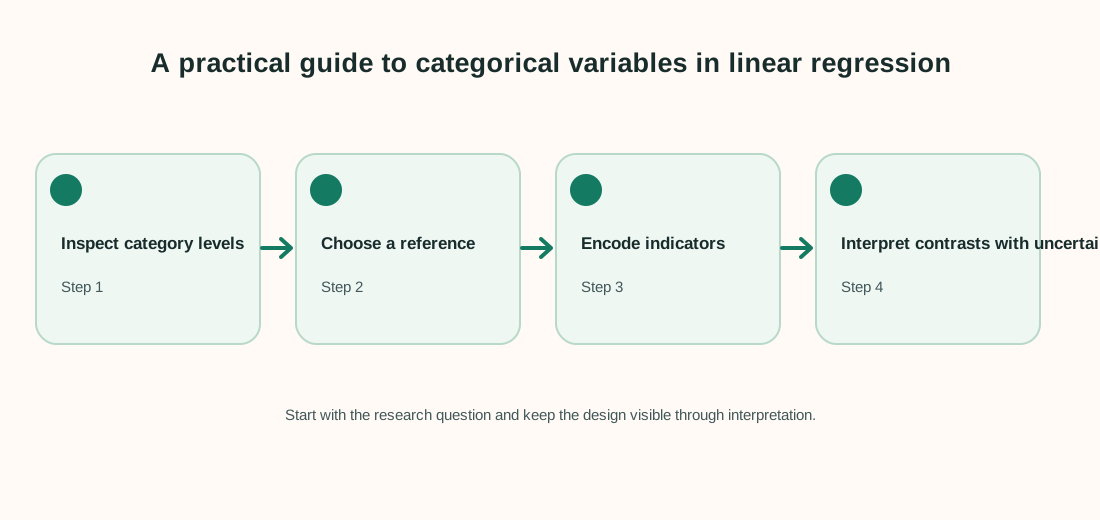
Steps to follow
- List category levels and counts before fitting.
- Choose and document a reference category.
- Use k−1 indicators when fitting an intercept model.
- Report each coefficient as an adjusted difference from the reference with uncertainty.
Keep a record of exclusions, recoding decisions and software settings. That makes the analysis easier to check and repeat.
Worked example
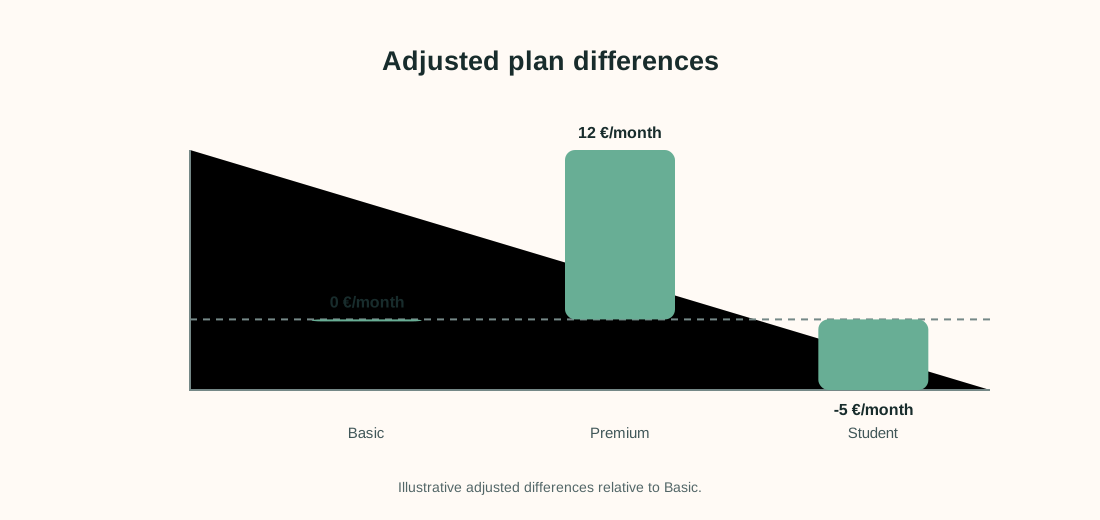
A model predicts monthly cost by plan type. Basic is the reference and the fitted coefficients are Premium +€12 and Student −€5.
| Plan | Modelled difference from Basic |
|---|---|
| Basic | €0 reference |
| Premium | +€12/month |
| Student | −€5/month |
If the model intercept for Basic is €40, predicted Premium cost is €40 + €12 = €52 and predicted Student cost is €40 − €5 = €35, holding other predictors fixed.
Interpret the result carefully
The coefficients describe adjusted model differences from Basic, not necessarily causal effects of choosing a plan. Their uncertainty and the covariate distribution matter.
Limit to keep in mind: Sparse categories can yield unstable estimates. Check category counts, missing levels and how unseen categories will be handled in future predictions.
When reporting an analysis, include the sample size, estimate, units and uncertainty. Explain why the method fits the sampling and measurement design. Separate planned tests from exploratory checks, and avoid saying that association proves a cause.
Frequently asked questions
Does changing the reference change predictions?
No. It changes the coefficient representation, not fitted values for the same model.
Can I use 1, 2, 3 for categories?
Only when a numeric trend with meaningful spacing is intended. Nominal categories usually need indicator coding.
How do I compare two non-reference levels?
Use a linear contrast between their coefficients and calculate uncertainty from the fitted model.
What if a new category appears at prediction time?
Plan how the model will handle unseen levels; the training model has no estimated effect for a brand-new category.