CLASSIFICATION · WORKED EXAMPLE
Logistic regression for binary classification
Logistic regression estimates the chance of an outcome such as pass/fail. A separate threshold turns that probability into a class label, so the threshold should match the cost of different mistakes.
Quick answer: fit logistic regression on labeled examples, inspect its probability estimates, choose a decision threshold using validation data and evaluate the final decisions on separate test data. The default 0.50 threshold is a starting rule, not a law.
What logistic regression predicts
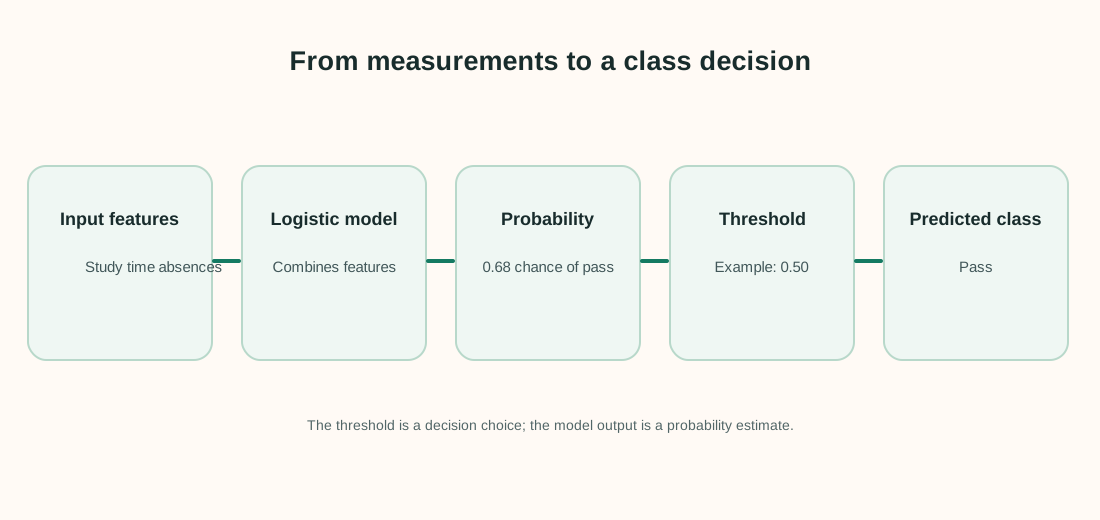
Despite its name, logistic regression is commonly used for classification. For a binary target, such as “passed” (1) or “did not pass” (0), it estimates a probability between 0 and 1. Its model applies the logistic, or sigmoid, function to a linear combination of the input features:
p = 1 / (1 + e−z), where z = b₀ + b₁x₁ + … + bₖxₖ.
The coefficients describe changes in log-odds when a feature changes by one unit while the other modeled features stay fixed. They do not directly mean a change in probability by that coefficient. The probability change depends on the starting values and all model inputs.
For example, a school might use study hours and absences to estimate the probability that a student passes an exam. The model learns coefficient values from labeled training rows. The example is for learning, not for making a consequential decision about a real student.
How a threshold turns probability into a class
A model can return an estimated probability such as 0.68. With a threshold of 0.50, that becomes a positive prediction because 0.68 is at least 0.50. A probability of 0.42 becomes a negative prediction. Moving the threshold changes the balance between false positives and false negatives.
If missing a positive case is costly, a team might consider a lower threshold to catch more positives, while accepting more false alarms. If false alarms are costly, it might consider a higher threshold. Choose this rule using a validation set and the real use case. Do not tune it on the final test set.
Also check whether the probability estimates are calibrated: among cases predicted near 0.70, about 70% should be positive over a sufficiently large, relevant sample. Strong class accuracy alone does not prove calibration.
Worked example: eight predicted cases
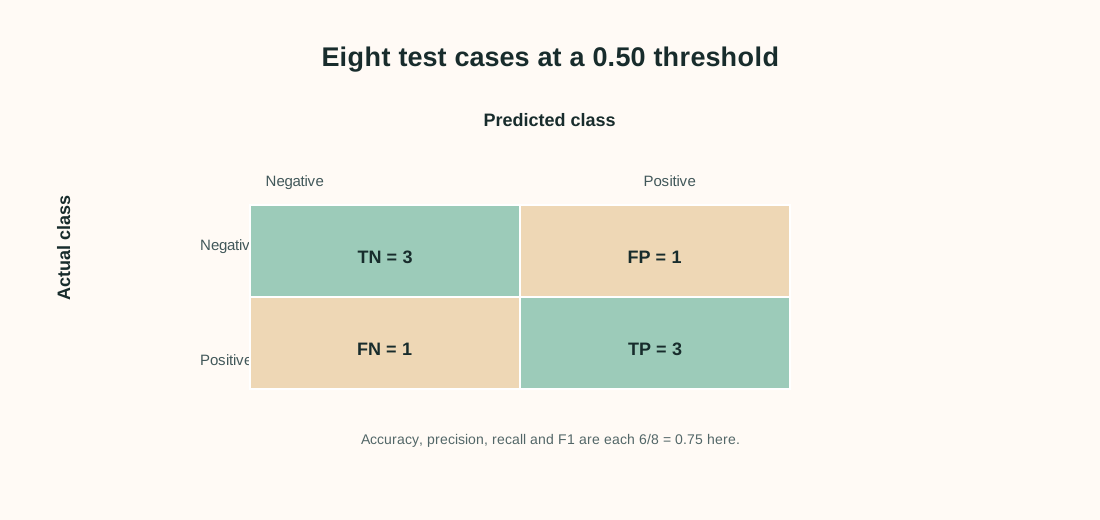
Suppose a held-out test set contains eight cases. The model returns these probabilities. At a threshold of 0.50, probabilities at or above 0.50 are positive predictions.
| Case | Actual class | Predicted probability | Predicted class |
|---|---|---|---|
| 1 | Negative | 0.10 | Negative |
| 2 | Negative | 0.20 | Negative |
| 3 | Positive | 0.42 | Negative |
| 4 | Negative | 0.58 | Positive |
| 5 | Positive | 0.64 | Positive |
| 6 | Positive | 0.81 | Positive |
| 7 | Negative | 0.30 | Negative |
| 8 | Positive | 0.90 | Positive |
Comparing predictions with known outcomes gives three true negatives, one false positive, one false negative and three true positives. Accuracy is (3 + 3) ÷ 8 = 75%. Precision is 3 ÷ (3 + 1) = 75%: three out of four positive predictions were correct. Recall is 3 ÷ (3 + 1) = 75%: the model found three of four actual positive cases. The F1 score, the harmonic mean of precision and recall, is also 75% in this particular example.
Eight rows are far too few to trust these percentages as stable estimates. A different handful of cases could change them sharply. Report the sample size and use a larger representative test set or cross-validation when appropriate.
Evaluate the model without leaking information
- Split data before learning transformations or selecting features.
- Fit scaling, imputation and feature-selection steps using training data only; apply those fitted steps to validation and test data.
- Use validation data to choose the threshold and model settings.
- Use the test data for a final, once-only evaluation after decisions are settled.
- Compare several metrics and inspect errors by relevant groups, while respecting privacy and sample size.
If records are repeated by person, school or time, a random row split can put closely related records on both sides. Choose a split that matches how the model will be used. This helps avoid overly optimistic results caused by information leaking across the split.
Frequently asked questions
Is logistic regression a regression model?
It is a statistical model with a regression-style linear predictor, but for a binary target it is used as a classifier that estimates class probabilities.
Must the threshold be 0.50?
No. Choose a threshold using validation data, the relative costs of mistakes and any required operating constraints. State how it was selected.
Does 75% accuracy mean the model is good?
Not by itself. Compare with a simple baseline, inspect class balance, precision and recall, uncertainty, errors across groups, and the cost of each type of mistake.
Can I interpret every coefficient as a probability increase?
No. A coefficient changes log-odds, not probability directly. Probability changes depend on the other feature values and the starting point.
Sources and next steps
- scikit-learn: Logistic regression — probability estimates, the sigmoid link and the classifier interpretation.
- scikit-learn: Confusion matrix — counts of true and false class decisions.
- scikit-learn: Common pitfalls and recommended practices — data leakage and safe train/test workflows.