STATISTICAL METHODS · BEGINNER GUIDE
How to Explain a Confidence Interval in Plain Language
Interpret a 95% confidence interval without saying there is a 95% chance that this fixed interval contains the true value.
Quick answer: A 95% confidence procedure would cover the fixed population value in about 95% of repeated samples under its assumptions. For one computed interval, explain the estimate, interval, method and population rather than assigning a probability to the fixed parameter.
What this method answers
A confidence interval combines a sample estimate with uncertainty from sampling and a chosen procedure. A narrow interval often signals greater precision, but precision depends on the model and sampling design.
The interval does not account for every source of uncertainty, such as measurement error, selection bias, model misspecification or changing populations, unless those are represented in the analysis. A confidence interval is not automatically a range of practically important values.
Before running a calculation, write down the population and the exact quantity you want to estimate. A method name alone does not define the question, the comparison or the assumptions.
Steps to follow
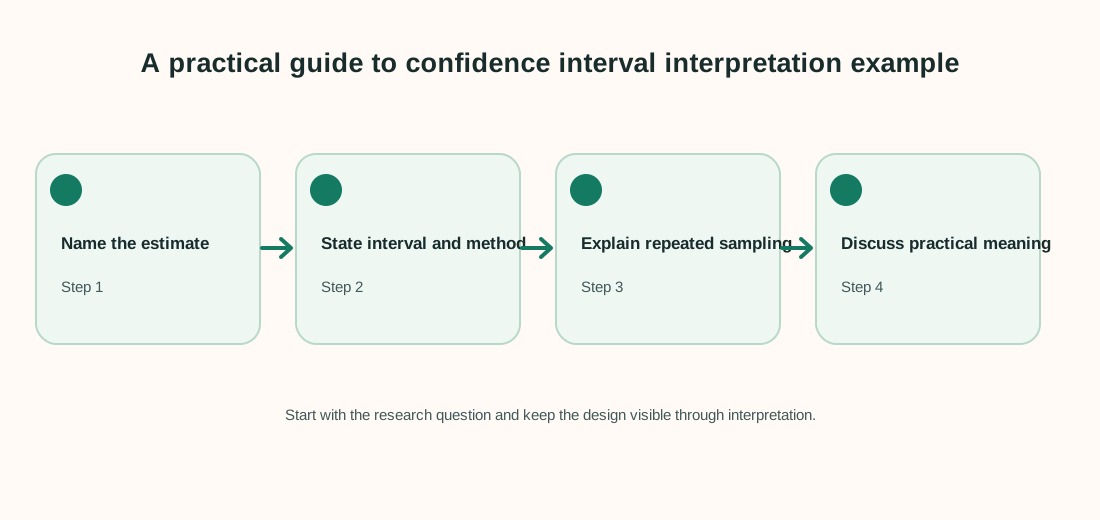
- Identify the population quantity and sample estimate.
- Report the interval endpoints, confidence level and method used.
- Describe the repeated-sampling interpretation with its assumptions.
- Compare the interval with a meaningful threshold or decision range.
Keep a record of exclusions, recoding decisions and software settings. That makes the analysis easier to check and repeat.
Worked example
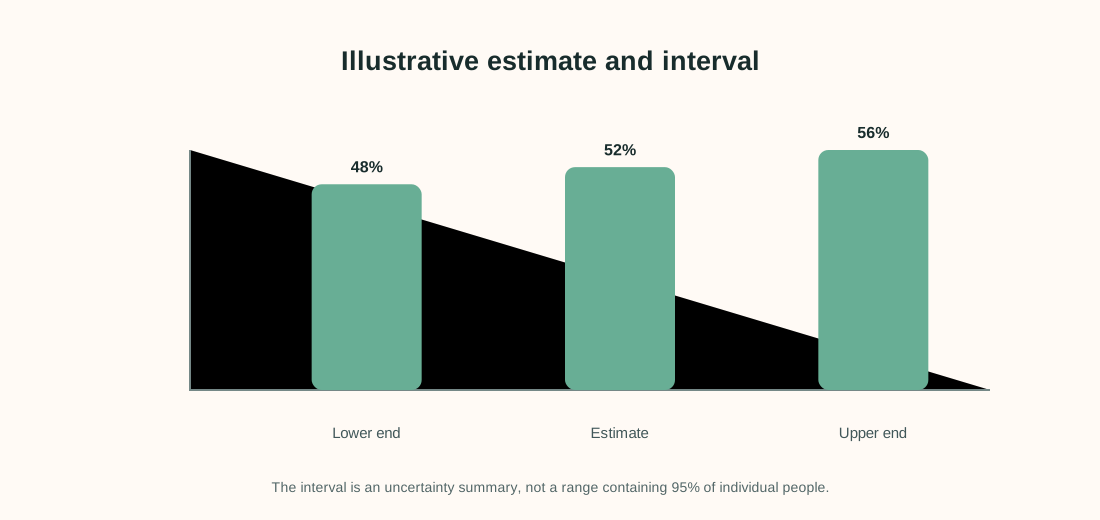
A survey estimates that 52% of a target population supports a proposal, with a reported 95% confidence interval from 48% to 56%. This is a constructed example.
| Estimate | Lower end | Upper end | Confidence level |
|---|---|---|---|
| 52% | 48% | 56% | 95% |
The interval width is 56% − 48% = 8 percentage points. A careful summary says: “The estimate was 52%; the method produced a 95% confidence interval of 48% to 56%, under the stated sampling and model assumptions.”
Interpret the result carefully
The interval includes values below and above 50%, so this example alone does not show a clear majority under a simple threshold interpretation. The survey’s design, question wording, response rate and weighting also matter.
Limit to keep in mind: Do not say there is a 95% probability that the fixed population percentage lies in this particular frequentist interval. The probability statement describes the long-run behavior of the interval procedure.
When reporting an analysis, include the sample size, estimate, units and uncertainty. Explain why the method fits the sampling and measurement design. Separate planned tests from exploratory checks, and avoid saying that association proves a cause.
Frequently asked questions
Does a 95% interval mean 95% of people are in the range?
No. It describes uncertainty about a population estimate, not the spread of individual responses.
Does a wider interval mean the estimate is wrong?
Not necessarily. It means the procedure gives a wider range of values compatible with the data and assumptions.
Can a confidence interval prove no effect?
No. It shows a range of estimates under a method; interpret the range against a meaningful effect threshold.
Do intervals include bias?
Only if the model explicitly represents those bias sources. Sampling intervals do not automatically capture measurement or selection bias.