STATISTICAL METHODS · BEGINNER GUIDE
Chi-Square Test of Independence: Worked Table
Calculate expected counts for a two-way table and understand what a chi-square independence test asks.
Quick answer: A chi-square test of independence asks whether two categorical variables are associated in a population, using the observed table and expected counts under independence. It tests the overall table, not which cells caused the difference.
What this method answers
Expected cell count under independence is row total × column total ÷ grand total. The Pearson statistic sums (observed−expected)²/expected across cells. Adequate expected counts and independent observations matter for the usual approximation.
Use this test for counts in mutually exclusive categories. If expected counts are sparse, especially in a 2×2 table, consider an exact test or an appropriate alternative.
Before running a calculation, write down the population and the exact quantity you want to estimate. A method name alone does not define the question, the comparison or the assumptions.
Steps to follow
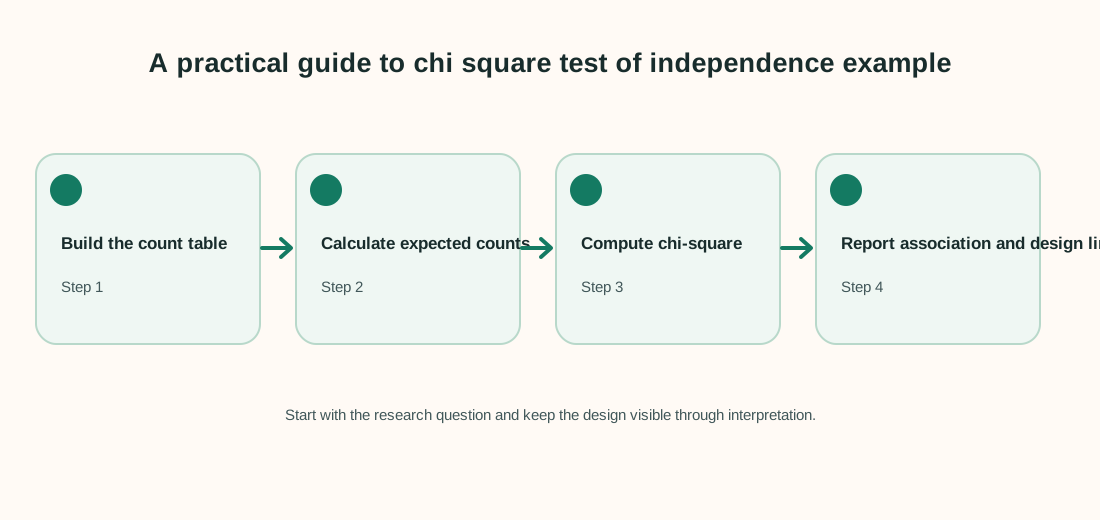
- Count each observation once in mutually exclusive row and column categories.
- Calculate row totals, column totals and each expected cell count.
- Check assumptions and calculate the Pearson chi-square statistic.
- Report the table, degrees of freedom, p-value, effect size and study design.
Keep a record of exclusions, recoding decisions and software settings. That makes the analysis easier to check and repeat.
Worked example
In an invented survey, 40 students choose online or in-person tutoring; 24 pass and 16 do not. The observed table is below.
| Format | Pass | Not pass | Total |
|---|---|---|---|
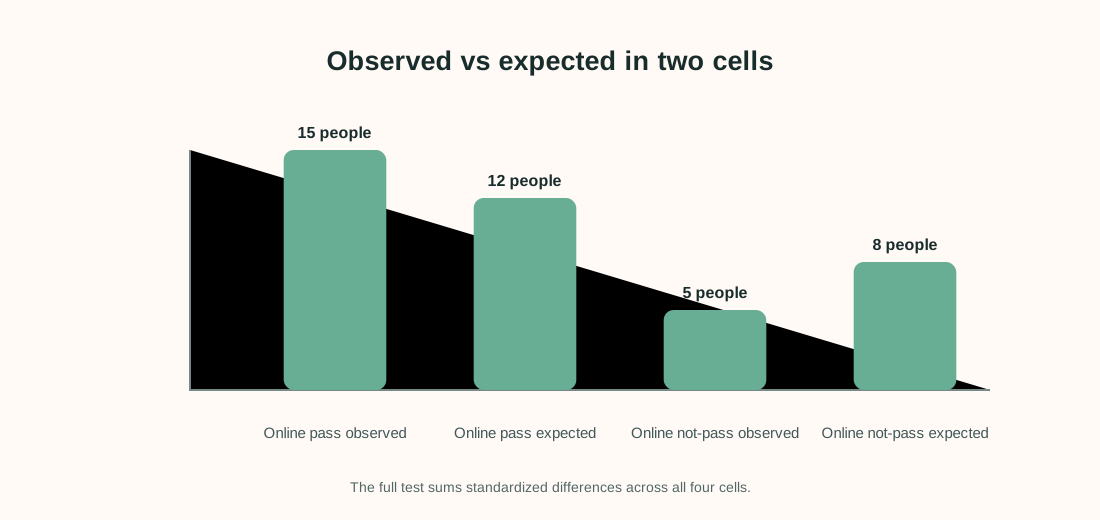
| Online | 15 | 5 | 20 |
| In person | 9 | 11 | 20 |
| Total | 24 | 16 | 40 |
Under independence, expected Online/Pass = 20×24/40 = 12. The four expected counts are 12, 8, 12 and 8. Pearson χ² = (15−12)²/12 + (5−8)²/8 + (9−12)²/12 + (11−8)²/8 = 3.75 with (2−1)(2−1)=1 degree of freedom.
Interpret the result carefully
This statistic measures mismatch between observed and independence-expected counts. To decide evidence, use its reference distribution and report an effect such as a risk difference or Cramér’s V alongside the table.
Limit to keep in mind: The toy table is small and observational; it cannot establish that tutoring format caused pass rates. The chi-square approximation and study design both need checking.
When reporting an analysis, include the sample size, estimate, units and uncertainty. Explain why the method fits the sampling and measurement design. Separate planned tests from exploratory checks, and avoid saying that association proves a cause.
Frequently asked questions
What is the null hypothesis?
The two categorical variables are independent in the target population.
How do I calculate an expected count?
Multiply its row total by its column total and divide by the grand total.
Does a significant test identify the important cells?
No. Use planned residual or post-hoc analysis with multiplicity control to study cell differences.
Can I use percentages instead of counts?
The test is based on counts and sample size; percentages alone are insufficient to reproduce it.