STATISTICAL METHODS · BEGINNER GUIDE
ANOVA for Non-Normal Data: What Are Your Options?
Learn how to respond to skewed outcomes or unusual residuals without treating a normality test as an automatic ANOVA switch.
Quick answer: First inspect the design, group sizes, outliers and residual patterns. ANOVA concerns the error structure; moderate departures do not always make it unusable, but severe skew, unequal variance or dependence may need a different model or robust method.
What this method answers
The classical ANOVA model uses assumptions about errors, including independence and a common variance; normality supports exact small-sample inference. The consequences of departures depend on sample size, balance, outliers and the question.
A rank-based test is not a magic, assumption-free version of ANOVA. It can target a different feature of the distributions. For counts or binary outcomes, a model for that outcome type may be more suitable than transforming data until a normal plot looks convenient.
Before running a calculation, write down the population and the exact quantity you want to estimate. A method name alone does not define the question, the comparison or the assumptions.
Steps to follow
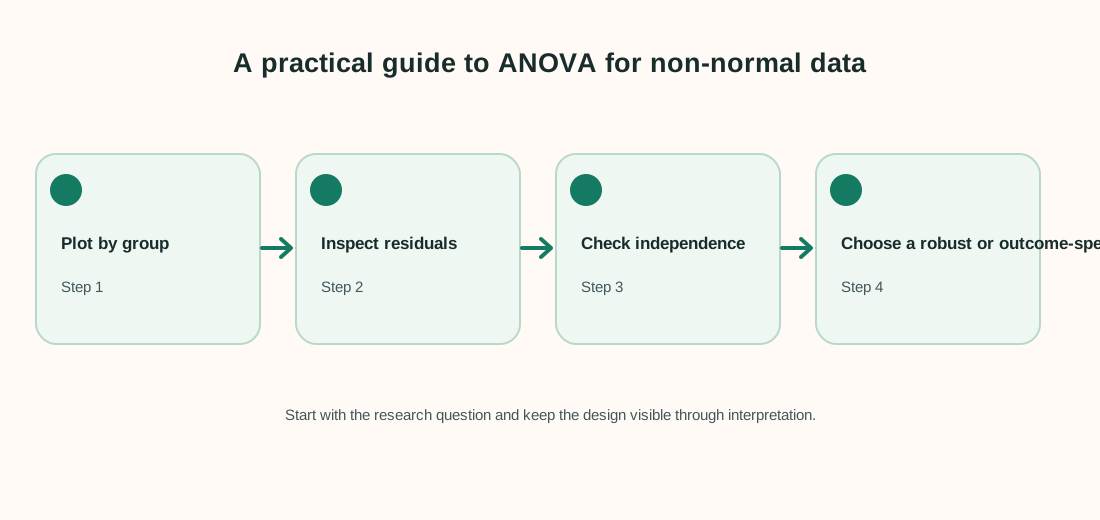
- Plot raw observations by group and inspect the scale, skew and unusual points.
- Fit the model that matches the design, then inspect residuals against fitted values and collection order.
- Check whether group sizes or variances are very different and whether observations are paired or clustered.
- Select an alternative based on the outcome and research question, and report why it was chosen.
Keep a record of exclusions, recoding decisions and software settings. That makes the analysis easier to check and repeat.
Worked example
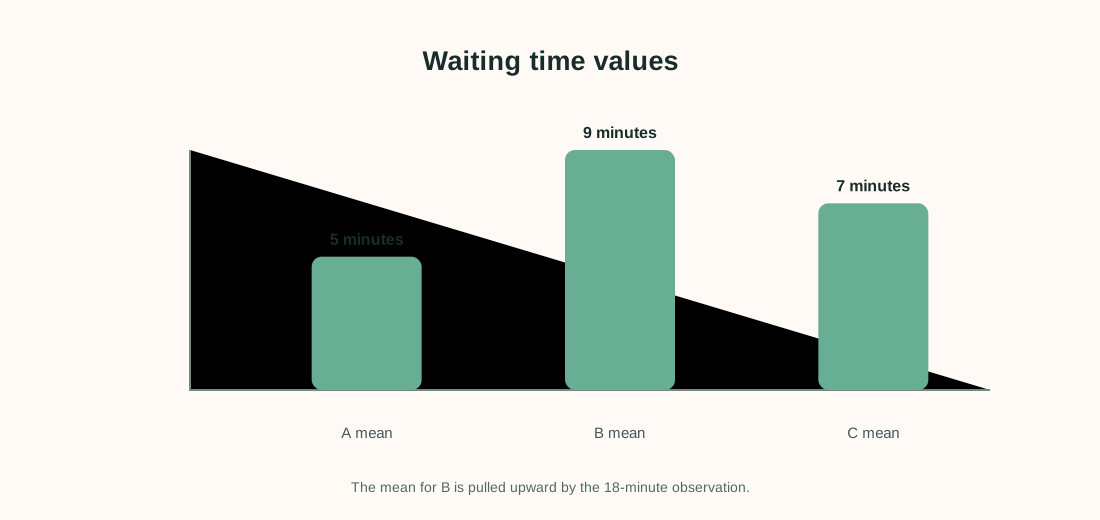
Three groups measure waiting time in minutes. One group has a long right tail, so the mean and residual plot should be inspected before choosing the analysis.
| Group | Illustrative waiting times |
|---|---|
| A | 4, 5, 5, 6 |
| B | 5, 6, 7, 18 |
| C | 6, 7, 7, 8 |
Group B includes an 18-minute wait that is much larger than its other values. Do not automatically delete it: check whether it is a valid wait, a recording error or evidence that the distribution has a long tail. Compare mean-based results with a defensible robust or transformed analysis if that matches the question.
Interpret the result carefully
A sensitivity analysis can show whether the conclusion depends on a few extreme values. Present the primary method selected for the design and describe any alternative as a check rather than searching until one result is significant.
Limit to keep in mind: The example is too small to estimate a stable distribution or justify a specific alternative. Real choices require the study design and the full data.
When reporting an analysis, include the sample size, estimate, units and uncertainty. Explain why the method fits the sampling and measurement design. Separate planned tests from exploratory checks, and avoid saying that association proves a cause.
Frequently asked questions
Should I run a normality test first?
Use plots and study knowledge. A normality test can be underpowered in small samples and overly sensitive in large ones.
Is Kruskal-Wallis always the replacement?
No. It tests rank-distribution differences and may not test equality of means. Choose it only if that question is suitable.
Can I log-transform an outcome?
Sometimes, when the measurement scale and scientific interpretation support it. State how transformed-scale results relate to the original scale.
What if observations are repeated?
Use a method that accounts for within-person or within-cluster dependence; changing to a rank test does not fix dependence.