STATISTICAL METHODS · BEGINNER GUIDE
Can You Use ANOVA for Two Groups?
Learn when one-way ANOVA can compare two group means, how its F statistic relates to a t-test, and what to check first.
Quick answer: Yes. A one-way ANOVA can compare two group means, although a two-sample t-test is often easier to explain. With the same observations and equal-variance assumptions, the ANOVA F statistic equals the square of the corresponding t statistic.
What this method answers
ANOVA compares variation between group means with variation among observations inside the groups. With only two groups, the question is whether their means differ. ANOVA does not tell you the size or practical importance of that difference by itself.
Use independent-groups methods only when each observation belongs to one independent group. If the same people are measured twice, analyze the paired differences instead. If group variances differ materially, consider a method designed for unequal variances, such as Welch’s t-test.
Before running a calculation, write down the population and the exact quantity you want to estimate. A method name alone does not define the question, the comparison or the assumptions.
Steps to follow
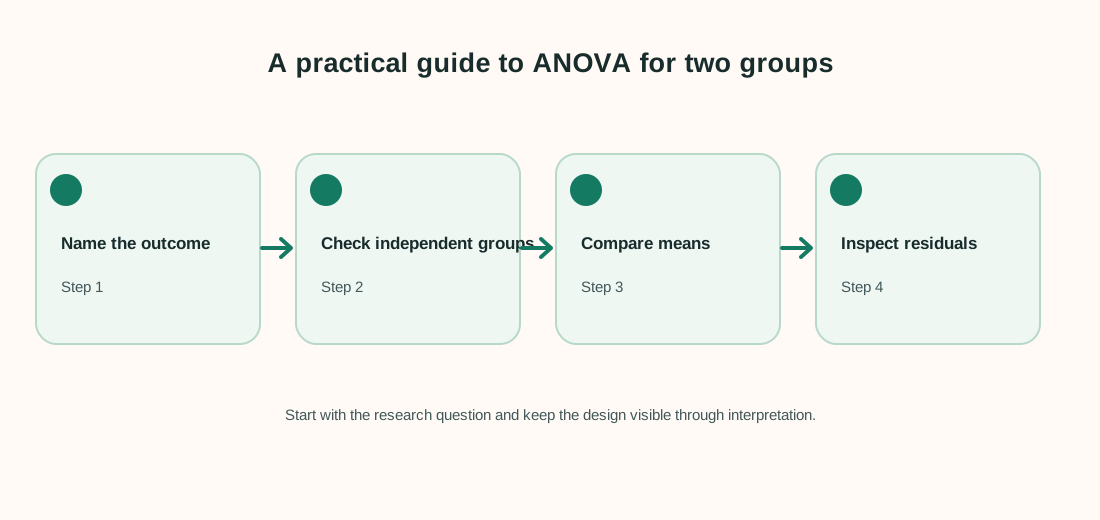
- State the two groups and the numeric outcome before looking at a p-value.
- Check whether observations are independent and whether a paired design was used.
- Compare the group means and their difference in the outcome’s original units.
- Use a suitable test, then inspect the data and model assumptions.
Keep a record of exclusions, recoding decisions and software settings. That makes the analysis easier to check and repeat.
Worked example
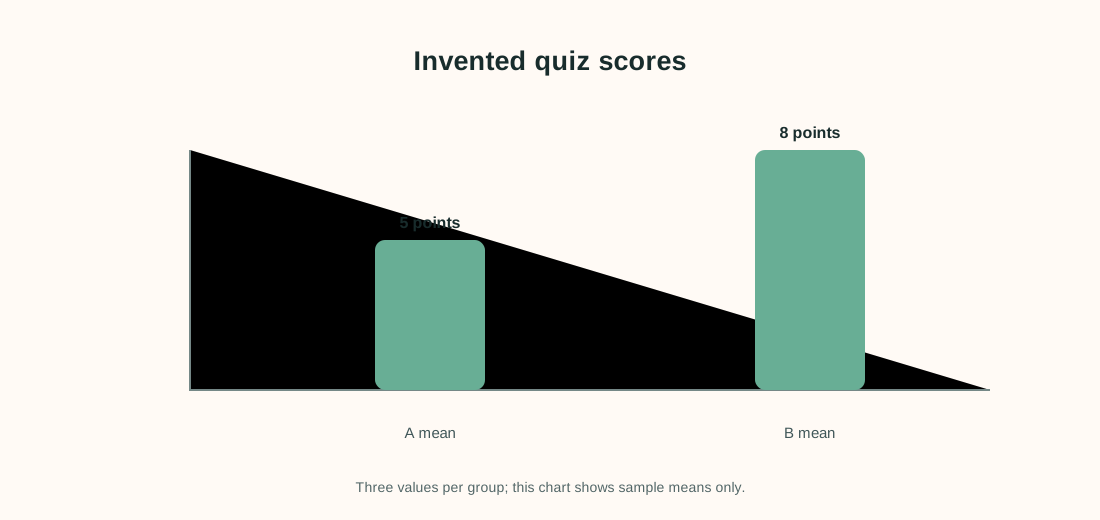
A teacher records quiz points from three students in each of two independent study groups. These six values are invented only to show the arithmetic.
| Group A | Group B |
|---|---|
| 4 | 7 |
| 5 | 8 |
| 6 | 9 |
The means are 5 and 8, so the observed difference is 3 points. The grand mean is 6.5. Between-group sum of squares is 13.5 and within-group sum of squares is 4. With 1 and 4 degrees of freedom, mean squares are 13.5 and 1, giving F = 13.5. Under the standard equal-variance two-group model, the matching t statistic has magnitude √13.5 ≈ 3.67.
Interpret the result carefully
The calculation says these sample means are separated relative to the variation inside these tiny groups. It does not establish that a study method caused higher scores or that the pattern would repeat in a larger class.
Limit to keep in mind: With only three observations per group, the estimate is highly uncertain and assumptions are difficult to assess. Do not treat a small p-value from a toy example as strong evidence.
When reporting an analysis, include the sample size, estimate, units and uncertainty. Explain why the method fits the sampling and measurement design. Separate planned tests from exploratory checks, and avoid saying that association proves a cause.
Frequently asked questions
Is ANOVA wrong when there are two groups?
No. It is mathematically valid under its assumptions, but a t-test often presents the same comparison more directly.
Does ANOVA show which group is higher?
For two groups, inspect the sample means and their difference. The F statistic itself is nonnegative and has no direction.
What if the same people are in both groups?
If each person contributes both measurements, preserve the pairing and analyze within-person differences.
Should I report only the p-value?
No. Report group summaries, the estimated difference, uncertainty, sample sizes and relevant design limits.